Topic 7.9 Notes – Carrying Out a Test for the Difference of Two Population Means
The Two-Sample t-Test for μ₁ − μ₂
This test is used when you have:
- Two independent groups
- Independent random samples
- or two groups from a randomized experiment
- A quantitative response variable
- A claim about μ₁ − μ₂ (usually whether it equals 0)
The big question is:
Is the observed difference in sample means large enough, relative to natural variability, to suggest the population means are different?
If is true and , then any difference we see in should just be random sampling variability.
Hypotheses in Context
You must define the parameters clearly.
- , , or
Example setup:
Suppose we compare mean exam scores of students who studied with flashcards vs. those who used practice tests.
- : true mean exam score for students using flashcards
- : true mean exam score for students using practice tests
Then:
Be precise. On FRQs, vague definitions of μ₁ and μ₂ lose points fast.
The Test Statistic
Here is the formula from the formula sheet:
Under the null (difference = 0), this simplifies to:
Break it down:
- Numerator → observed difference − expected difference (usually 0)
- Denominator → standard error of the difference
So the t-statistic measures:
How many standard errors the observed difference is from 0.
Large means stronger evidence against .
Why a t-Distribution
The sampling distribution of
is approximately t-distributed, assuming:
- Independent random samples or random assignment
- Nearly normal populations or large samples
The t-model accounts for extra uncertainty because we use sample standard deviations , not population σ’s.
Degrees of Freedom
Technology gives the exact df. On your calculator (2-SampTTest), it’s reported automatically.
The df will fall between:
- smaller of and
- and
If you must approximate by hand on the AP exam:
Always report:
- t statistic
- df
- p-value
Students often forget df on FRQs. That costs points.
Visualizing the p-Value
Suppose you compute for a two-sided test.
Here’s what that means visually. The shaded regions in both tails beyond and represent the p-value:
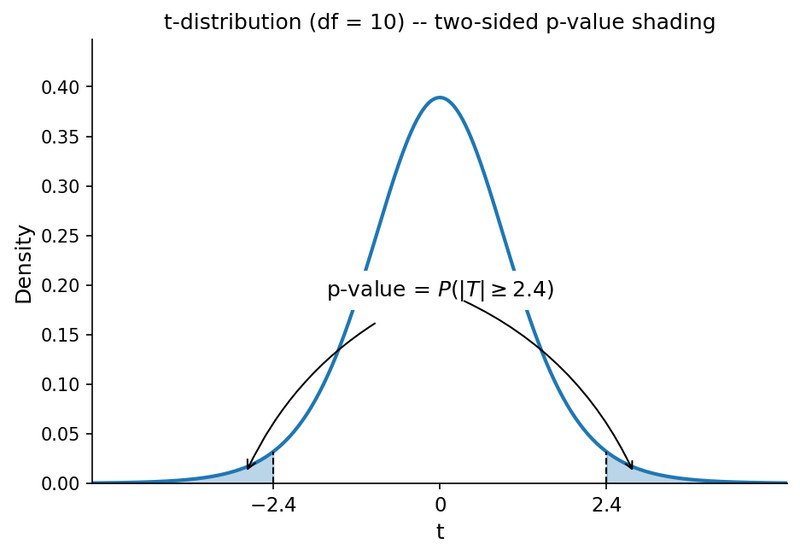
Two-sided p-value on a t-distribution (df = 10)
The p-value is the probability, assuming is true, of getting a difference in sample means at least as extreme as the one observed.
That phrase “assuming is true” must appear in your interpretation.
Correct interpretation example:
If the true mean exam scores for the two study methods are equal, the probability of observing a difference in sample means as large as the one found (or larger) is 0.018.
It is not the probability that is true.
Decision and Conclusion
Formal decision rule:
- If → Reject
- If → Fail to reject
Never say “accept .”
Full conclusion structure:
- Compare p to α
- State reject/fail to reject
- State evidence about
- Refer to population means in context
Example ending:
Since p = 0.018 is less than α = 0.05, we reject . There is convincing evidence that the true mean exam scores differ between students who used flashcards and those who used practice tests.
Notice it’s about population means, not sample means.
How This Supports a Research Question
The result of the test becomes your statistical reasoning.
If the research question was:
Do the two study methods lead to different average exam scores?
Your test provides the evidence to answer that question about the populations those students represent.
You are never proving a difference. You are assessing whether the sample provides convincing evidence of one.
Key Takeaways
Two-Sample t-Test for a Difference of Means
A significance test comparing two population means using sample means and estimated standard errors.
Two-Sample t-Test Statistic
(x̄1 - x̄2 - 0) divided by the square root of s1^2/n1 + s2^2/n2.
Standard Error of the Difference of Two Means
The estimated spread of x̄1 - x̄2, computed as the square root of s1^2/n1 + s2^2/n2.
Degrees of Freedom for a Two-Sample t-Test
A technology-based value between the smaller of n1 - 1 and n2 - 1 and n1 + n2 - 2.
Null Hypothesis for Two Means
States that the population means are equal, written as μ1 = μ2 or μ1 - μ2 = 0.
Alternative Hypothesis for Two Means
States that the population means differ, or that one population mean is greater or less.
p-Value in a Two-Sample t-Test
The probability, assuming equal population means, of getting a result at least as extreme.
Decision Rule Using α
Reject H0 when p-value ≤ α; otherwise fail to reject H0.
Conclusion in Context for a Two-Sample t-Test
State whether the data give convincing evidence about a difference in population means in context.
Using Technology for a Two-Sample t-Test
Calculator or software output provides the test statistic, degrees of freedom, and p-value.
Significance Level
The cutoff probability used to decide whether to reject the null hypothesis.
Notes
Two-Sample t-Test for a Difference of Means
A significance test comparing two population means using sample means and estimated standard errors.
Two-Sample t-Test Statistic
(x̄1 - x̄2 - 0) divided by the square root of s1^2/n1 + s2^2/n2.
Standard Error of the Difference of Two Means
The estimated spread of x̄1 - x̄2, computed as the square root of s1^2/n1 + s2^2/n2.
Degrees of Freedom for a Two-Sample t-Test
A technology-based value between the smaller of n1 - 1 and n2 - 1 and n1 + n2 - 2.
Null Hypothesis for Two Means
States that the population means are equal, written as μ1 = μ2 or μ1 - μ2 = 0.
Alternative Hypothesis for Two Means
States that the population means differ, or that one population mean is greater or less.
p-Value in a Two-Sample t-Test
The probability, assuming equal population means, of getting a result at least as extreme.
Decision Rule Using α
Reject H0 when p-value ≤ α; otherwise fail to reject H0.
Conclusion in Context for a Two-Sample t-Test
State whether the data give convincing evidence about a difference in population means in context.
Using Technology for a Two-Sample t-Test
Calculator or software output provides the test statistic, degrees of freedom, and p-value.
Significance Level
The cutoff probability used to decide whether to reject the null hypothesis.
