Topic 7.5 Notes – Carrying Out a Test for a Population Mean
What a One-Sample t-Test for a Mean Does
A one-sample t-test is used to test a claim about a population mean when the population standard deviation is unknown.
That “σ unknown” part is why we use t instead of z. We estimate variability using the sample standard deviation , which adds extra uncertainty. The t-distribution accounts for that.
You’ll always see:
- Parameter: (true population mean)
- Null hypothesis:
- Alternative hypothesis:
The test statistic measures how many standard errors the sample mean is from the hypothesized mean.
with
You don’t have to memorize this formula. You can rebuild it from
(statistic − parameter) / standard error.
Calculating the Test Statistic
Let’s walk through a quick example.
A fitness company claims its protein bars have a mean of 20 grams of protein. A random sample of 16 bars has:
We test vs. .
- Standard error
- Test statistic
- Degrees of freedom
Interpretation of :
The sample mean is 2 standard errors below the claimed mean.
Larger absolute values of mean stronger evidence against .
Finding the p-Value
The p-value is the probability, assuming is true, of getting a test statistic as extreme or more extreme than the one observed.
For our test statistic with df = 15, that means finding the area to the left of −2.0 under a -distribution.
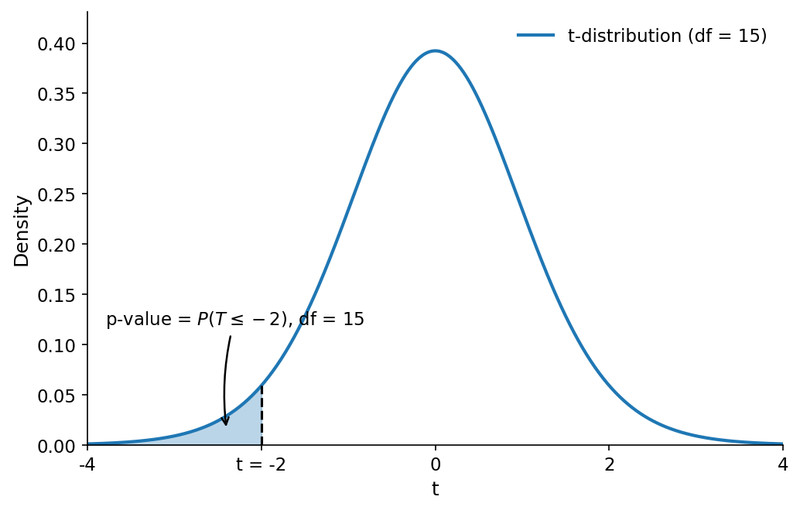
Left-tailed p-value for , df = 15
Because this is left-tailed, we use the shaded area to the left of −2.0 with df = 15 as the p-value.
You can:
- Use a t-table (round df down if needed).
- Use a calculator:
STAT → TESTS → T-Test.
Always report:
- df = 15
- p-value (from technology or table)
Two-tailed test? Double the one-tail area.
One-tailed test? Don’t double it. That mistake costs points.
Interpreting the p-Value
A correct interpretation sounds like this:
The p-value is the probability of getting a sample mean of 18.8 grams or less, assuming the true mean protein content is 20 grams.
Two things must be there:
- Assuming the null is true
- In context
Never say:
- “The probability that the null is true is…”
- “There is a 3% chance the mean is 20.”
The parameter is fixed. The sample result varies.
Making and Justifying a Decision
You compare the p-value to .
- If p ≤ α, reject .
- If p > α, fail to reject .
Suppose and .
Since , we reject .
Conclusion in context:
There is convincing evidence at the 0.05 level that the true mean protein content of these bars is less than 20 grams.
Notice how the final sentence answers the research question about the population.
Matched Pairs t-Test
If data are paired (before/after, twins, same person twice), reduce the data to differences first.
Example: blood pressure before and after medication.
- Compute each person’s difference.
- Let = mean difference, = SD of differences.
- Test .
- Use with df = , where is the number of pairs.
Conditions apply to the differences, not the original measurements. That detail shows up a lot on FRQs.
Key Takeaways
One-Sample T-Test for a Population Mean
A significance test for whether a population mean differs from a hypothesized value using sample data.
Matched Pairs T-Test
A t-test on the mean of pairwise differences from two related measurements on the same subjects.
T-Test Statistic for a Mean
t = (x̄ - μ0)/(s/√n), comparing the sample mean to the null mean in standard-error units.
Test Statistic for Matched Pairs
t = (d̄ - μd0)/(sd/√n), using the sample mean and standard deviation of differences.
Standard Error of the Mean
s/√n, the estimated standard deviation of the sampling distribution of the sample mean.
Degrees of Freedom for a One-Sample T-Test
n - 1 for a single sample or for the number of matched-pair differences.
Sampling Distribution of the T Statistic
When sampling from a normal population, the statistic follows a t-distribution with n - 1 degrees of freedom.
One-Tailed vs. Two-Tailed Test
Use one tail for directional alternatives and two tails for non-directional alternatives.
Conclusion of a Mean T-Test in Context
State whether the data give convincing evidence for the alternative claim about the population mean.
Using a T-Table to Estimate P-Value
Match the test statistic with df = n - 1 and read the tail probability; double it for two-sided tests.
Calculator Output for a One-Sample T-Test
Report the test statistic, p-value, and degrees of freedom from technology when performing the test.
P-Value for a Population Mean Test
The probability, assuming the null mean is true, of getting the observed result or more extreme.
Decision and Conclusion in a Significance Test
Compare p-value to α to reject or fail to reject, never claiming the null is true.
Null and Alternative Hypotheses for a Mean
Statements about the population mean that define the claim being tested.
Notes
One-Sample T-Test for a Population Mean
A significance test for whether a population mean differs from a hypothesized value using sample data.
Matched Pairs T-Test
A t-test on the mean of pairwise differences from two related measurements on the same subjects.
T-Test Statistic for a Mean
t = (x̄ - μ0)/(s/√n), comparing the sample mean to the null mean in standard-error units.
Test Statistic for Matched Pairs
t = (d̄ - μd0)/(sd/√n), using the sample mean and standard deviation of differences.
Standard Error of the Mean
s/√n, the estimated standard deviation of the sampling distribution of the sample mean.
Degrees of Freedom for a One-Sample T-Test
n - 1 for a single sample or for the number of matched-pair differences.
Sampling Distribution of the T Statistic
When sampling from a normal population, the statistic follows a t-distribution with n - 1 degrees of freedom.
One-Tailed vs. Two-Tailed Test
Use one tail for directional alternatives and two tails for non-directional alternatives.
Conclusion of a Mean T-Test in Context
State whether the data give convincing evidence for the alternative claim about the population mean.
Using a T-Table to Estimate P-Value
Match the test statistic with df = n - 1 and read the tail probability; double it for two-sided tests.
Calculator Output for a One-Sample T-Test
Report the test statistic, p-value, and degrees of freedom from technology when performing the test.
P-Value for a Population Mean Test
The probability, assuming the null mean is true, of getting the observed result or more extreme.
Decision and Conclusion in a Significance Test
Compare p-value to α to reject or fail to reject, never claiming the null is true.
Null and Alternative Hypotheses for a Mean
Statements about the population mean that define the claim being tested.
