Topic 9.1 Notes – Introducing Statistics: Do Those Points Align?
1. How Points Align Around a Line
When we draw a scatterplot of two quantitative variables, we usually imagine a theoretical line that captures the overall trend.
Here’s the key idea:
Each point does not sit exactly on that line.
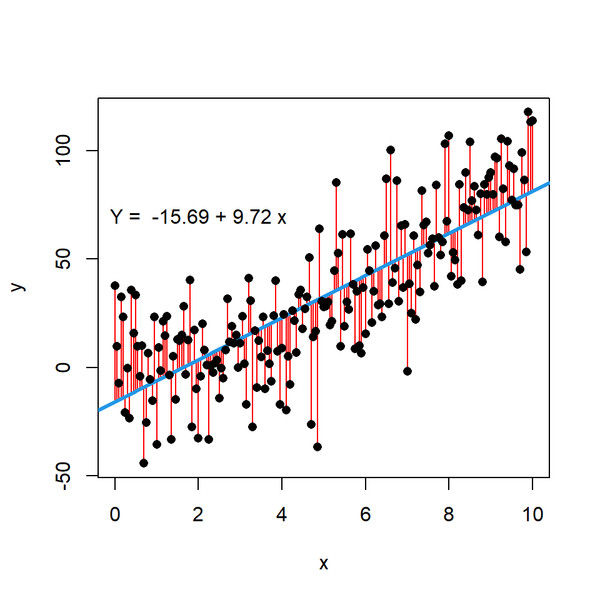
The vertical distance from a point to the line represents variation. (Later you’ll call these residuals, but here we’re just thinking conceptually.)
In the scatterplot below, the blue line represents the overall trend, and the red vertical segments show those vertical distances.
Scatterplot with regression line and vertical residuals
That vertical gap shows how much the actual data value differs from what the line predicts.
Some variation is normal:
- People differ.
- Measurements aren’t perfect.
- Random factors affect outcomes.
Because of this variation, any conclusion we draw about the relationship is uncertain. The central question becomes:
Is this variation just random noise, or is it showing a meaningful pattern?
That difference matters a lot.
2. Random Error vs Systematic Error
All deviations from the line fall into one of two broad categories.
Random Error
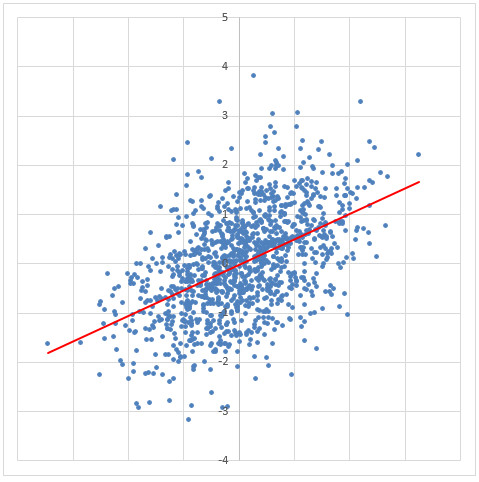
This is unpredictable scatter around the line.
You’ll see:
- Points above and below the line with no clear pattern.
- Roughly equal spread across the range of x-values.
- No curves, no clusters, no structure.
Random scatter around a linear trend
Random error comes from:
- Natural variability between individuals.
- Small, uncontrollable environmental factors.
- Minor measurement imprecision.
Important:
Random error does not mean your model is bad. It just means real data isn’t perfect.
If the scatter looks like a random cloud around the line, a linear model is probably reasonable.
Systematic Error
This is non-random, predictable deviation.
Now the points don’t just bounce randomly around the line. They follow a pattern.
You might see:
- A curved shape.
- Points mostly above the line for small x and mostly below for large x.
- Distinct clusters of points.
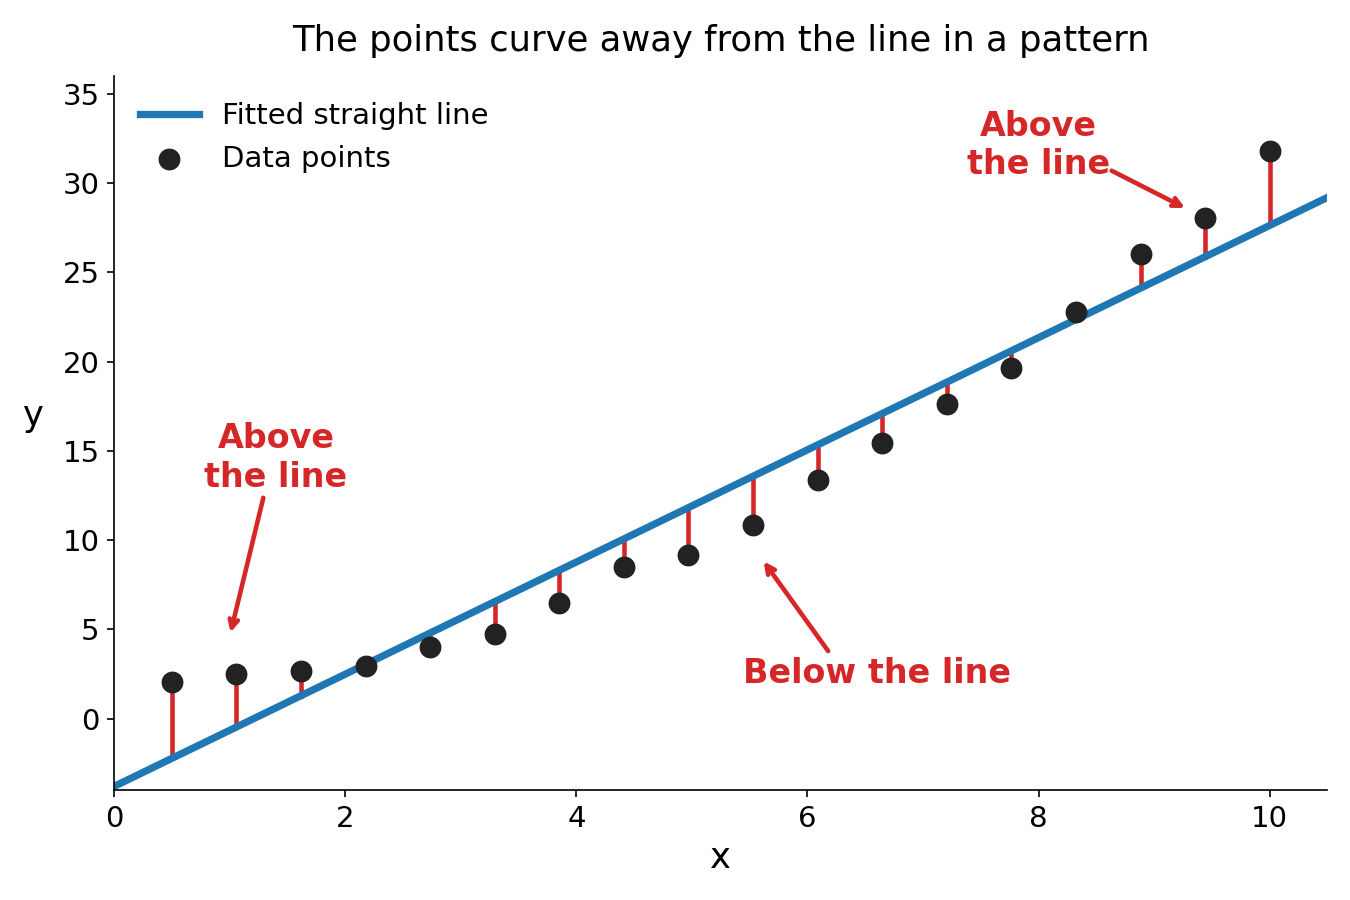
Curved pattern showing systematic deviation: the data bend, so the points sit above the straight line at both ends and below it in the middle
Systematic error usually suggests:
- The relationship is not linear.
- A variable is missing.
- There is consistent bias in measurement.
When you see structure in the deviations, the linear model is likely inappropriate or incomplete.
3. Questions to Ask When Looking at a Scatterplot
When you’re given a scatterplot with a fitted line, train yourself to think like this:
- Do the points generally follow a straight-line pattern?
- Do the deviations look random?
- Is there curvature?
- Are there clusters or group differences?
- Are there unusual points that stand out?
These are the kinds of questions the AP exam expects you to raise when interpreting variation.
If the scatter appears random → linear model may be appropriate.
If you see structure → something else may be going on.
Sometimes a question will literally ask what the variation suggests. You should be able to say something like:
The scatter appears random around the line, suggesting the linear model is reasonable.
or
The curved pattern in the deviations suggests a linear model may not be appropriate.
Always say it in context using the actual variables.
4. Correlation, Chance, and Confounding
Even if points seem aligned, that doesn’t automatically mean the relationship is meaningful.
Correlation Can Happen by Chance
Random samples can sometimes produce patterns that look real.
With enough variability, two unrelated variables might appear associated just due to sampling variability. That’s why we’re cautious about jumping to conclusions from one sample.
Correlation Does Not Imply Causation
Even a strong linear alignment does not prove cause and effect.
There may be a confounding variable:
- A third variable that influences both x and y.
- It creates an association between them.
Structure to remember:
- X and Y are correlated.
- Z affects both.
- The observed relationship may not be causal.
Unless random assignment is involved, you cannot claim causation from a scatterplot. On free-response questions, students lose points every year for implying cause from observational data.
5. Reducing Uncertainty About Alignment
Because variation creates uncertainty, statisticians strengthen evidence by:
- Using large samples
Larger samples reduce the impact of random fluctuation. - Repeating studies in multiple populations
If the same pattern appears again and again, it’s less likely due to chance.
When a relationship consistently appears across large random samples, it becomes more convincing that the association is real and not just random noise.
Key Takeaways
Correlation
The strength and direction of a linear relationship between two quantitative variables.
Correlation Does Not Imply Causation
An association between variables does not prove that one variable causes changes in the other.
Confounding Variable
A third variable related to both variables that can create or distort an observed association.
Random And Systematic Error
Unpredictable scatter around a line is random, while consistent departures indicate systematic bias.
Notes
Correlation
The strength and direction of a linear relationship between two quantitative variables.
Correlation Does Not Imply Causation
An association between variables does not prove that one variable causes changes in the other.
Confounding Variable
A third variable related to both variables that can create or distort an observed association.
Random And Systematic Error
Unpredictable scatter around a line is random, while consistent departures indicate systematic bias.
