Topic 5.7 Notes – Sampling Distributions for Sample Means
1. What the Sampling Distribution of x̄ Is
Picture taking a random sample of size , calculating its mean, then repeating that process over and over. Each time you get a different .
The sampling distribution of is the distribution of all those possible sample means.
Important grounding:
- Population → parameters:
- Mean
- Standard deviation
- Sample → statistics:
- Mean
- Standard deviation
This topic is about how behaves across many samples, not about individual data values.
We care because it lets us:
- Predict how close is likely to be to
- Calculate probabilities about sample means
- Build confidence intervals and hypothesis tests later
Here’s the idea visually. The top row shows different population distributions. The rows underneath show the sampling distributions of when and when .
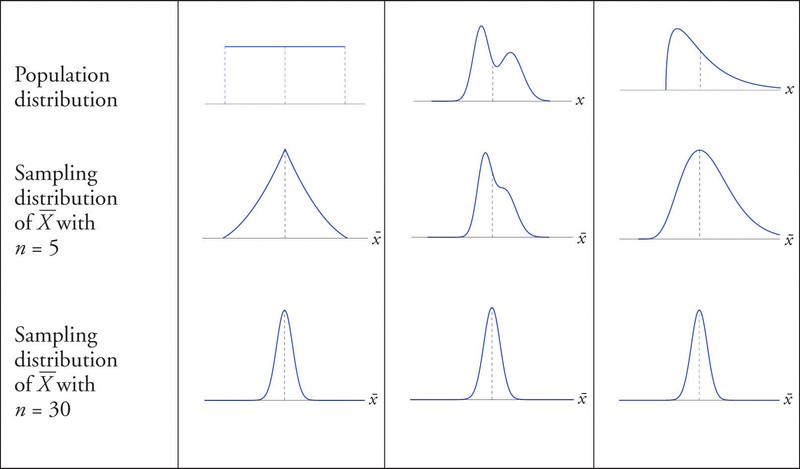
Population distributions and sampling distributions of for and
Notice how the sampling distribution is typically less spread out than the population, and how it becomes more nearly normal and tighter as the sample size increases.
2. Mean and Standard Deviation of x̄
Assume we are randomly sampling with replacement from a population with mean and standard deviation .
Center of the sampling distribution
The mean of all possible sample means equals the population mean.
That makes an unbiased estimator of . On average, sample means hit the true mean.
If a problem gives you , then the center of the sampling distribution is automatically 72. No extra work.
Spread of the sampling distribution
This is the standard error (SE) of the mean.
What affects it?
- Larger → more variability in
- Larger → divide by bigger → smaller variability
So bigger samples give more precise estimates.
Quick example:
If and ,
Even though individuals vary by 12 units, sample means only vary by 2.
Common mistake on tests: using instead of when calculating a z-score for a sample mean.
Sampling without replacement and the 10% condition
The formula is exact for sampling with replacement.
If sampling without replacement, the true standard deviation is slightly smaller.
On the AP exam:
- If , the difference is negligible.
- This is the 10% condition and it supports independence.
If the 10% condition is met, just use like normal.
3. When the Sampling Distribution Is Normal
To use normal probability calculations, the sampling distribution must be (approximately) normal.
Two situations:
Population is normal
If the population distribution is normal, then the sampling distribution of is exactly normal for any sample size.
Even if , you’re good.
Population is not normal
If the population is not normal, we use the Central Limit Theorem (CLT).
The CLT says:
As gets large, the distribution of becomes approximately normal, regardless of population shape.
Rule of thumb:
- → usually large enough.
If the population is extremely skewed or has strong outliers, you may need a larger .
On free-response, you must justify normality by stating either:
- Population is normal
- , so CLT applies
4. Using the Sampling Distribution to Find Probabilities
When finding a probability involving a sample mean:
- Check normal condition (population normal or ).
- Identify
- Compute
- Use normalcdf or a z-table.
Example setup:
Suppose , , .
Then
If asked for ,
Then find .
Be careful with interpretation. You are talking about sample means of size 64, not individual values.
Correct style:
“There is a ___% chance that the mean of a random sample of 64 observations will exceed 52.”
5. Interpreting in Context
Always:
- Mention sample means
- Include correct units
- Reference the population
Remember:
- is fixed.
- varies from sample to sample.
This variability is exactly what the sampling distribution models.
Key Takeaways
Sampling Distribution of the Sample Mean
The distribution of all possible sample means from repeated random samples of size n.
Sampling Without Replacement and the 10% Condition
Without replacement, spread is slightly smaller; if n is under 10% of N, the difference is negligible.
Normal Population Implies Normal x̄
If the population distribution is normal, the sample mean distribution is normal for any sample size.
Shape, Center, and Spread of a Sampling Distribution for x̄
Describe x̄ by its shape, mean μ, and standard deviation σ/√n with appropriate conditions.
Interpreting Probabilities for x̄
State chances about sample means in context, using the variable’s units and the population described.
Mean and Standard Error of x̄
For independent sampling, the center is μ and the spread is σ/√n.
Effect of Sample Size on the Distribution of x̄
Larger samples make x̄ less variable and, usually by n ≥ 30, more nearly normal.
Notes
Sampling Distribution of the Sample Mean
The distribution of all possible sample means from repeated random samples of size n.
Sampling Without Replacement and the 10% Condition
Without replacement, spread is slightly smaller; if n is under 10% of N, the difference is negligible.
Normal Population Implies Normal x̄
If the population distribution is normal, the sample mean distribution is normal for any sample size.
Shape, Center, and Spread of a Sampling Distribution for x̄
Describe x̄ by its shape, mean μ, and standard deviation σ/√n with appropriate conditions.
Interpreting Probabilities for x̄
State chances about sample means in context, using the variable’s units and the population described.
Mean and Standard Error of x̄
For independent sampling, the center is μ and the spread is σ/√n.
Effect of Sample Size on the Distribution of x̄
Larger samples make x̄ less variable and, usually by n ≥ 30, more nearly normal.
