Topic 4.1 Notes – Introducing Statistics: Random and Non-Random Patterns?
1. Random Variation and Non-Random Patterns
Statistics exists because data vary. Even if nothing “special” is happening, outcomes will not all be the same. That variation can come from two broad sources.
Random Variation
Random variation is variation that happens by chance alone.
It has no consistent cause and no predictable direction. It shows up because of natural variability or random error in measurement or sampling.
Examples you’ve already seen:
- A random sample mean differs from the population mean.
- One class period scores slightly higher than another on the same test.
- A fair coin lands heads 6 times in 10 flips.
Here’s something important students forget:
Random does not mean evenly spread.
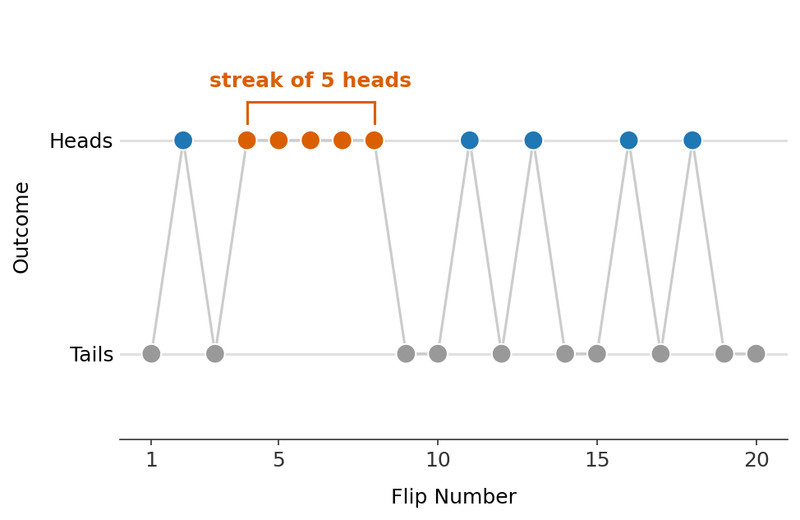
Twenty fair coin flips with a streak of five heads
That streak of heads might look suspicious, but streaks happen naturally in random processes. Random data can produce:
- Clusters
- Gaps
- Outliers
- Short-term trends
None of those automatically mean something non-random is happening.
Non-Random Patterns
A non-random (systematic) pattern happens when there is a consistent, identifiable cause.
You’ll often see:
- A clear relationship between two variables (study time and test score).
- A consistent difference between groups (treated patients recover faster).
- A survey that consistently overrepresents one viewpoint because of poor wording.
These patterns are often connected to:
- Bias (systematic error in how data were collected)
- Confounding variables
- A real underlying relationship
The key difference is consistency. Systematic patterns tend to push results in a particular direction.
Random Error vs Bias
Students mix these up constantly, so keep this straight:
| Random Error | Bias |
|---|---|
| Caused by chance | Caused by a systematic flaw |
| Unpredictable direction | Predictable direction |
| Affects variability | Affects accuracy |
| Reduced with larger samples | Not fixed by larger samples |
A bigger sample size smooths out random variation. It does not fix biased data.
2. Patterns in Data and the Questions They Suggest
When you look at a graph or table and notice a pattern, your job is not to celebrate it. Your job is to ask a question:
Could this reasonably happen just from random chance?
Patterns suggest questions such as:
- Is this difference between groups large relative to natural variability?
- Could sampling variability explain this result?
- Is there a lurking variable?
- Was there bias in how the data were gathered?
You are not proving anything yet. You are deciding whether randomness is still a plausible explanation.
On quizzes, this often shows up as a prompt asking whether a result “provides convincing evidence.” That wording is a clue. You’re being asked whether the pattern is likely random or not.
3. Why Random Patterns Can Look Non-Random
This is where intuition gets people in trouble.
Human Pattern-Seeking
Your brain wants meaning. If 8 of the last 10 customers chose one product, it feels intentional. But small samples naturally swing around.
Sampling Variability
If you take multiple random samples from the same population, the statistics will vary.
Here are three different random samples taken from the same population. Each dotplot shows the sample values and its mean.
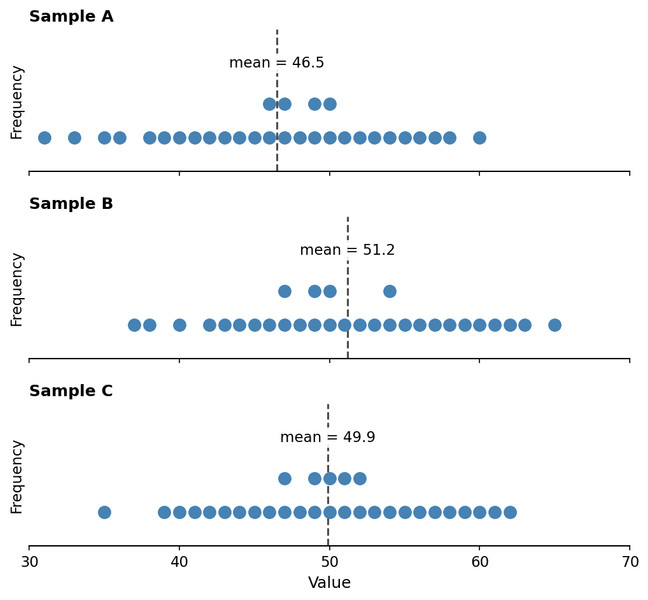
Three random samples from the same population
Notice that the means are not identical. The samples were collected the same way from the same population, yet the centers shift slightly. That is sampling variability in action.
Even when:
- The population parameter stays fixed
- There is no true relationship
You can still observe noticeable differences between samples. That does not prove a real effect exists.
This idea is foundational. Later, when you learn about p-values, you’ll be calculating how likely your observed result would be if only random variation were operating.
4. The Big Idea About Uncertainty
Because variation can be random or systematic, conclusions in statistics are never 100% certain.
We weigh evidence. We ask how plausible randomness is. If something would be very unlikely due to chance alone, we lean toward a non-random explanation.
But we never escape uncertainty entirely.
Key Takeaways
Patterns in Data Do Not Necessarily Mean Non-Randomness
An apparent trend or difference can occur by chance and does not alone prove a real effect.
Questions Suggested By Patterns In Data
Possible follow-up questions about whether an observed relationship is due to chance or a systematic cause.
Random Variation
Differences in data caused by chance alone, without a systematic pattern or cause.
Systematic Variation
Differences in data caused by a consistent influence rather than chance alone.
Random Error vs. Systematic Error
Unpredictable error causes scatter, while consistent error pushes results in a particular direction.
Notes
Patterns in Data Do Not Necessarily Mean Non-Randomness
An apparent trend or difference can occur by chance and does not alone prove a real effect.
Questions Suggested By Patterns In Data
Possible follow-up questions about whether an observed relationship is due to chance or a systematic cause.
Random Variation
Differences in data caused by chance alone, without a systematic pattern or cause.
Systematic Variation
Differences in data caused by a consistent influence rather than chance alone.
Random Error vs. Systematic Error
Unpredictable error causes scatter, while consistent error pushes results in a particular direction.
