Topic 6.4 Notes – Setting Up a Test for a Population Proportion
1. What a One-Sample z-Test for a Population Proportion Is
This test is used when you have:
- One categorical variable
- Each individual is classified as success/failure
- A claim about one population proportion
Key pieces:
- Parameter: = true population proportion
- Statistic: = sample proportion
- Claimed value:
You assume the null hypothesis is true (that ) and ask:
If that were true, how unusual is our sample result?
Because of the normal model for sampling distributions, we can use a z-test when conditions are met.
This is not a t-test and not a chi-square test. If it’s one proportion and success/failure data, this is your method.
2. Writing Hypotheses for a Population Proportion
Everything revolves around the parameter , not .
The Null Hypothesis
- Always about the population proportion
- Always includes an equality
Even if the wording says “at least 40%,” we test at the boundary:
The null represents the status quo or no change.
The Alternative Hypothesis
- Also about
- Uses a strict inequality
Three possibilities:
- (right-tailed)
- (left-tailed)
- (two-tailed)
The direction comes from the research question, not the data.
If the question asks, “Has the proportion increased?” → use .
If it asks, “Is it different?” → use .
Students often mess this up by choosing the direction based on . Don’t do that. The alternative is decided before looking at results.
Always define in context. For example:
= true proportion of seniors at Central High who plan to attend a four-year college.
That wording matters on FRQs.
3. Conditions for a One-Proportion z-Test
Before doing inference, you must justify that the normal model applies.
Random
Data must come from:
- A random sample, or
- A randomized experiment
You must say this in context. If it’s not random, you cannot generalize to the population.
Independence
Observations must be independent.
If sampling without replacement, check the 10% condition:
In words:
The population is at least 10 times the sample size.
This prevents dependence from being a problem.
Large Counts Condition (Normality)
We model with a normal distribution assuming is true.
That means we use , not .
Check:
Both expected successes and expected failures must be at least 10.
This is one of the most common AP mistakes. If you use here, you lose credit.
Why the Normal Model Works
Here’s the idea visually. Under the null, the sampling distribution of is centered at and has standard deviation . The shaded right tail represents the probability of getting a sample proportion that far above if were true.
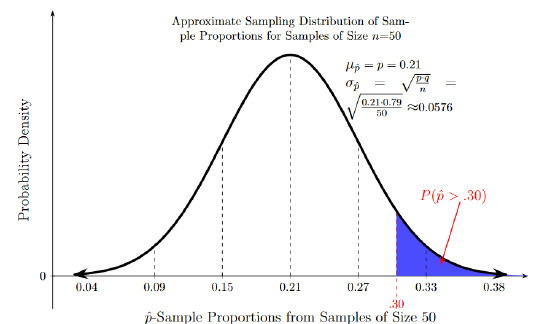
Under , the sampling distribution of :
- Is approximately normal
- Has mean
- Has standard deviation
If your sample proportion falls far out in a tail, that’s evidence against .
Choosing the Correct Test Method
When you see:
- One categorical variable
- A single sample
- A claim about one population proportion
The correct method is:
One-sample z-test for a population proportion
On multiple choice, they often describe the scenario in words and expect you to recognize this structure without saying “z-test.” Train yourself to scan for: single proportion + success/failure.
Key Takeaways
Hypotheses for a Population Proportion
H0: p = p0; Ha: p < p0, p > p0, or p ≠ p0.
One-Sided vs. Two-Sided Alternative Hypotheses
One-sided uses < or >; two-sided uses ≠.
Boundary of Equality
Even for one-sided tests, the null is tested at p = p0.
One-Sample Z-Test for a Population Proportion
The inference procedure for testing one categorical population proportion using sample data.
No Difference or No Effect in the Null Hypothesis
The hypothesized value usually represents no change, difference, or treatment effect.
Random Condition
Data must come from a random sample or randomized experiment.
Independent Condition / 10% Condition
When sampling without replacement, check that n ≤ 0.10N to justify independence.
Large Counts Condition for a Hypothesis Test
Assuming H0 is true, require np0 ≥ 10 and n(1 - p0) ≥ 10.
Null and Alternative Hypotheses
The assumed population claim includes equality, while the competing claim uses <, >, or ≠.
Notes
Hypotheses for a Population Proportion
H0: p = p0; Ha: p < p0, p > p0, or p ≠ p0.
One-Sided vs. Two-Sided Alternative Hypotheses
One-sided uses < or >; two-sided uses ≠.
Boundary of Equality
Even for one-sided tests, the null is tested at p = p0.
One-Sample Z-Test for a Population Proportion
The inference procedure for testing one categorical population proportion using sample data.
No Difference or No Effect in the Null Hypothesis
The hypothesized value usually represents no change, difference, or treatment effect.
Random Condition
Data must come from a random sample or randomized experiment.
Independent Condition / 10% Condition
When sampling without replacement, check that n ≤ 0.10N to justify independence.
Large Counts Condition for a Hypothesis Test
Assuming H0 is true, require np0 ≥ 10 and n(1 - p0) ≥ 10.
Null and Alternative Hypotheses
The assumed population claim includes equality, while the competing claim uses <, >, or ≠.
