Topic 1.7 Notes – Summary Statistics for a Quantitative Variable
What Summary Statistics Are
A statistic is a numerical summary of sample data. Later, you’ll use statistics to estimate population parameters, but here we’re just describing data.
In this topic, summary statistics describe:
- Center → Where is the “middle”?
- Position → Where does a value fall relative to others?
- Variability (spread) → How spread out are the values?
Always report statistics with units and in context.
Example: “The mean commute time for sampled employees was 24.6 minutes,” not just “24.6.”
Measures of Center and Position
The Mean
The mean is the average:
- Add all values, divide by .
- It’s the balancing point of the distribution.
- Uses every data value.
- Nonresistant → pulled by outliers.
If one value is extremely high, the mean shifts toward it.
Effect of changing units:
- Add/subtract a constant → mean changes by that amount.
- Multiply by a constant → mean multiplies by that constant.
Best choice when the distribution is symmetric, unimodal, and has no outliers.
The Median
The median is the middle value after ordering the data.
- Odd : exact middle.
- Even : average of the two middle values (the AP standard).
The median splits the data so that 50% are at or below it.
It’s resistant. One extreme value barely changes it.
If a distribution is skewed, the median gives a better sense of “typical.”
Also remember:
- Right-skewed → mean > median
- Left-skewed → mean < median
That difference shows up often in multiple-choice questions.
Quartiles and IQR Structure
Once data are ordered:
- Q1 = median of the lower half
- Q3 = median of the upper half
- Middle 50% lies between Q1 and Q3
These values define the structure of a boxplot.
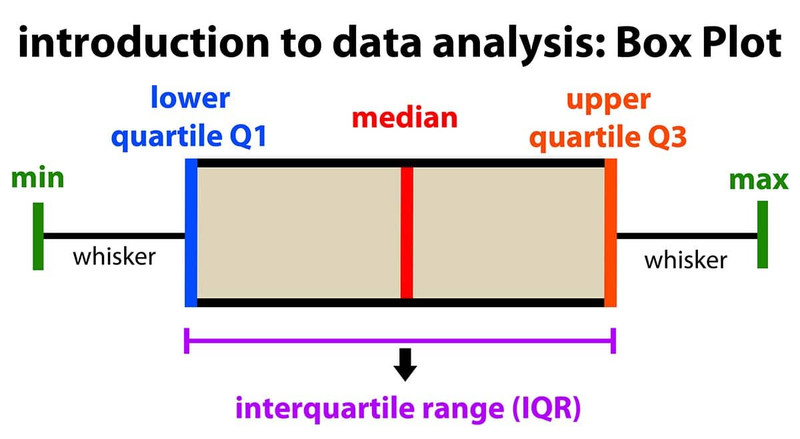
Boxplot structure with quartiles and IQR
The box runs from Q1 to Q3, with the median shown as the line inside the box. The whiskers extend to the minimum and maximum values.
This visual matters because many questions describe boxplots instead of raw numbers.
Percentiles
The pᵗʰ percentile is the value with p% of observations at or below it.
If a student’s height is at the 85th percentile, that means 85% of students are that height or shorter.
Students often confuse percentile with percent. A percentile describes position in a distribution, not a percent score.
Measures of Variability
Center alone isn’t enough. Two data sets can have the same mean but very different spread.
Range
Range = max − min
Simple, but very nonresistant. One extreme value changes it a lot.
Interquartile Range (IQR)
- Measures spread of the middle 50%.
- Resistant to outliers.
- Pairs naturally with the median.
Standard Deviation
- Measures typical distance from the mean.
- Uses squared deviations.
- Divides by (degrees of freedom).
- is the sample variance.
- Nonresistant.
Unit changes:
- Add/subtract constant → unchanged.
- Multiply by constant → multiplies by that constant.
If scores go from points to percentages (multiply by 2, say), the standard deviation also doubles.
Choosing the Right Statistics
Resistant vs Nonresistant
| Resistant | Nonresistant |
|---|---|
| Median | Mean |
| IQR | Standard deviation |
| Range |
Outliers heavily affect nonresistant measures.
Which Pair to Report?
- Symmetric, no outliers → Mean and standard deviation
- Skewed or outliers present → Median and IQR
On free-response questions, you must justify your choice based on shape or outliers. Saying “median because it’s better” earns nothing. Say something like:
“The distribution of wait times is right-skewed with a high outlier, so the median and IQR better describe the center and spread.”
Identifying Outliers
1.5 × IQR Rule
- Compute Q1 and Q3
- Find IQR
- Lower fence =
- Upper fence =
- Values outside fences are outliers
This is what boxplots use.
2 Standard Deviation Rule
A value more than 2 standard deviations above or below the mean may be considered an outlier.
Works best for roughly symmetric distributions.
Key Takeaways
Statistic vs. Parameter
A statistic summarizes sample data, while a parameter summarizes an entire population.
Mean
The sum of all data values divided by the number of values, x̄ = Σx/n.
Median
The middle value in ordered data; for even n, usually the average of the two middle values.
Quartiles and Interquartile Boundaries
Q1 is the median of the lower half, Q3 of the upper half; together they bound the middle 50%.
Percentile
The value with p percent of the data less than or equal to it.
Range
The difference between the maximum and minimum values in a data set.
Interquartile Range (IQR)
The difference between the third and first quartiles, Q3 - Q1.
Standard Deviation and Variance
Standard deviation measures typical distance from the mean; its square, s², is the sample variance.
Effect of Changing Units on Summary Statistics
Adding or subtracting a constant shifts center measures; multiplying or dividing rescales both center and spread.
Choosing Mean and Standard Deviation vs. Median and IQR
Use mean and standard deviation for roughly symmetric data; use median and IQR for skewed data or outliers.
Outlier Rules
Possible outliers are values below Q1 - 1.5IQR or above Q3 + 1.5IQR, or at least 2 standard deviations from the mean.
Resistant vs. Nonresistant Measures
Median and IQR resist outliers; mean, standard deviation, and range are strongly affected by them.
Notes
Statistic vs. Parameter
A statistic summarizes sample data, while a parameter summarizes an entire population.
Mean
The sum of all data values divided by the number of values, x̄ = Σx/n.
Median
The middle value in ordered data; for even n, usually the average of the two middle values.
Quartiles and Interquartile Boundaries
Q1 is the median of the lower half, Q3 of the upper half; together they bound the middle 50%.
Percentile
The value with p percent of the data less than or equal to it.
Range
The difference between the maximum and minimum values in a data set.
Interquartile Range (IQR)
The difference between the third and first quartiles, Q3 - Q1.
Standard Deviation and Variance
Standard deviation measures typical distance from the mean; its square, s², is the sample variance.
Effect of Changing Units on Summary Statistics
Adding or subtracting a constant shifts center measures; multiplying or dividing rescales both center and spread.
Choosing Mean and Standard Deviation vs. Median and IQR
Use mean and standard deviation for roughly symmetric data; use median and IQR for skewed data or outliers.
Outlier Rules
Possible outliers are values below Q1 - 1.5IQR or above Q3 + 1.5IQR, or at least 2 standard deviations from the mean.
Resistant vs. Nonresistant Measures
Median and IQR resist outliers; mean, standard deviation, and range are strongly affected by them.
