Topic 5.2 Notes – The Normal Distribution, Revisited
1. The Normal Distribution
A normal distribution is a continuous probability distribution with a very specific shape:
- Bell-shaped
- Symmetric
- Unimodal (one peak)
- Centered at the mean
For a normal distribution:
- Mean = median = mode
- Total area under the curve = 1 (100%)
- 50% of the area is on each side of
Continuous random variable reminder
A continuous random variable can take any value in an interval.
Example: If you glance at a clock at a random time, the probability the minute hand is between the 3 and 6 is . That’s an interval.
For continuous variables:
Probabilities are assigned to intervals, not single values.
Area = Probability
In a normal distribution, area under the curve over an interval = probability that falls in that interval.
If weights of apples are normally distributed, the area between 140 g and 160 g represents the probability a randomly chosen apple weighs in that range.
Describing a normal distribution
Always describe using:
- Center →
- Spread →
- Shape → symmetric, bell-shaped
Empirical Rule
For quick mental estimates:
- 68% within
- 95% within
- 99.7% within
The diagram below shows how those percentages are distributed symmetrically around the mean.
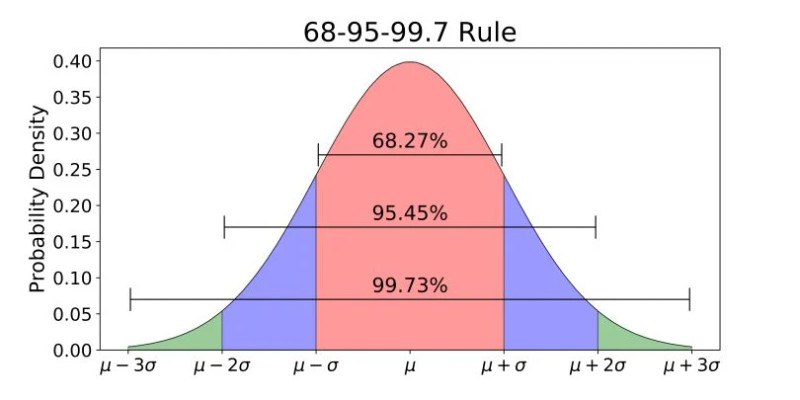
Empirical Rule for a normal distribution
That 95% within 2σ shows up constantly in inference later.
2. Z-Scores and the Standard Normal Model
A z-score tells how many standard deviations a value is from the mean.
- Positive → above the mean
- Negative → below the mean
- Larger magnitude → farther from the mean
Why we standardize
Standardizing converts any normal distribution into the standard normal distribution:
- Mean = 0
- SD = 1
Then you can use:
- Z-table
- normalcdf
- invNorm
Calculating probabilities step by step
Suppose exam scores are normal with , . Find .
- Sketch and shade left of 90.
- Standardize:
- Use normalcdf(-1E99, 90, 82, 6)
or normalcdf(-1E99, 1.33, 0, 1)
The result is the area to the left, which is the probability a randomly selected student scored 90 or below.
Common calculator forms:
Common mistakes I see on quizzes:
- Forgetting to shade first
- Mixing up left vs right tail
- Using invNorm when you need normalcdf
3. Finding Values from a Given Area
Now we reverse it. You’re given an area and must find the boundary value.
You work backward.
General process
- Sketch and shade the given area.
- Find the corresponding z-score using table or invNorm.
- Convert back:
Interpreting statements correctly
These phrases matter.
- Lowest p%
Left-tail area. - Highest p%
Right-tail area. - Middle p%
Usually symmetric around the mean. - Most extreme p%
Split into two tails:
If a problem says “most extreme 8%,” that means 4% in each tail. Students miss that all the time.
Remember: invNorm expects left-tail area, so adjust accordingly.
4. When Is a Normal Model Appropriate?
Normal distributions are:
- Symmetric
- Bell-shaped
- No strong skew
- No extreme outliers
If the distribution is heavily skewed, the normal model won’t approximate probabilities well.
For sampling distributions (quick review):
- Proportions → Large Counts condition
and - Means → or population is normal
If asked whether a normal model is appropriate, say something like:
“The histogram of battery lifetimes appears approximately symmetric and bell-shaped with no outliers, so using a normal model to approximate probabilities is reasonable.”
Always reference shape.
Key Takeaways
Continuous Random Variable
A variable that can take any value within an interval, with probabilities assigned to intervals.
Area Under a Normal Curve
The area over an interval equals the probability that a value falls in that interval.
Total Area and Symmetry of a Density Curve
All area equals 1, and a normal curve has 0.5 on each side of the mean.
Empirical Rule
About 68%, 95%, and 99.7% of values lie within 1, 2, and 3 standard deviations.
Standard Normal Distribution
The normal distribution with mean 0 and standard deviation 1, used with z-scores.
Finding Normal Probabilities
Standardize if needed, then use a table or technology to find area for the interval.
Finding an Interval from a Given Area
Use z-scores or technology to find boundary values, then convert back to the original scale.
Approximate Normality
A distribution can be modeled normally if it is roughly symmetric and bell-shaped.
Comparing Values with Z-Scores
Convert values from different distributions to standardized units so their relative positions can be compared.
Normal Distribution
A continuous, symmetric, unimodal bell-shaped distribution determined by its mean and standard deviation.
Z-Score
A standardized value showing how many standard deviations an observation is from the mean.
Normal Distribution Interval Types
Areas under a normal curve can describe left-tail, right-tail, middle, or split-tail intervals.
Percentile
The percent of observations in a distribution that are at or below a value.
Notes
Continuous Random Variable
A variable that can take any value within an interval, with probabilities assigned to intervals.
Area Under a Normal Curve
The area over an interval equals the probability that a value falls in that interval.
Total Area and Symmetry of a Density Curve
All area equals 1, and a normal curve has 0.5 on each side of the mean.
Empirical Rule
About 68%, 95%, and 99.7% of values lie within 1, 2, and 3 standard deviations.
Standard Normal Distribution
The normal distribution with mean 0 and standard deviation 1, used with z-scores.
Finding Normal Probabilities
Standardize if needed, then use a table or technology to find area for the interval.
Finding an Interval from a Given Area
Use z-scores or technology to find boundary values, then convert back to the original scale.
Approximate Normality
A distribution can be modeled normally if it is roughly symmetric and bell-shaped.
Comparing Values with Z-Scores
Convert values from different distributions to standardized units so their relative positions can be compared.
Normal Distribution
A continuous, symmetric, unimodal bell-shaped distribution determined by its mean and standard deviation.
Z-Score
A standardized value showing how many standard deviations an observation is from the mean.
Normal Distribution Interval Types
Areas under a normal curve can describe left-tail, right-tail, middle, or split-tail intervals.
Percentile
The percent of observations in a distribution that are at or below a value.
