Topic 7.2 Notes – Constructing a Confidence Interval for a Population Mean
1. What the t-Distribution Is and Why We Use It
When estimating a population mean , we rarely know the population standard deviation . So we replace it with the sample standard deviation .
That substitution adds extra variability. Because of that, the standardized statistic
follows a t-distribution, not a normal distribution.
How the t-distribution compares to normal
In the graph below, both curves are centered at 0. The green t-curve with df = 1 has a lower peak and thicker tails than the blue normal curve.
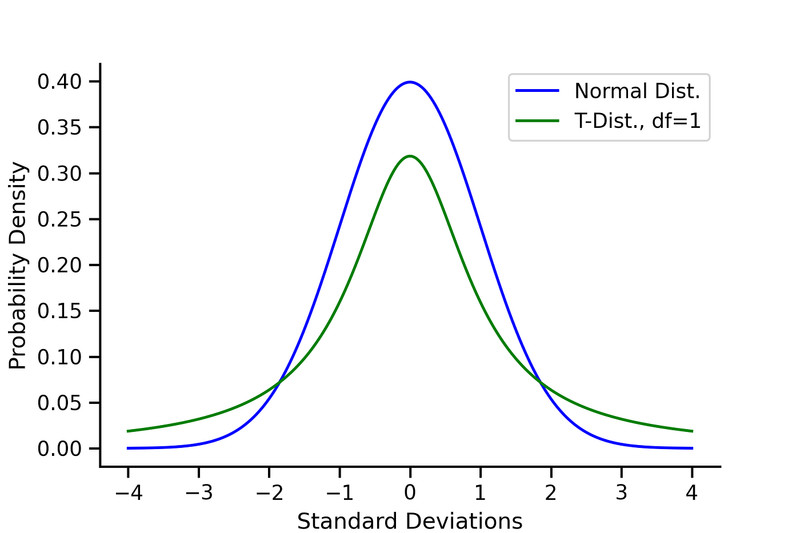
Normal distribution vs. t-distribution (df = 1)
Key properties:
- Symmetric, bell-shaped, centered at 0
- Heavier tails than the normal distribution
- More area in the extremes
- Accounts for uncertainty from using instead of
Degrees of freedom (df)
For a one-sample mean:
As df increases:
- Tails get thinner
- The t-curve gets closer to the normal curve
Large sample → t ≈ normal
Small sample → noticeably wider tails → larger critical values
That’s why small samples produce wider intervals.
2. When to Use a One-Sample t-Interval
You use a one-sample t-interval when:
- You’re estimating a population mean
- Data come from one quantitative variable
- is unknown (which is typical)
- Data come from:
- A random sample, or
- A randomized experiment (if estimating a mean response)
If the problem says “average,” “mean,” or “how much on average,” your brain should immediately think: mean → probably t.
Matched Pairs
Sometimes data come in pairs, like:
- Before/after measurements
- Twin studies
- Matched subjects
Treat this as one sample of differences:
- Compute each pair’s difference.
- Use those differences as your sample.
- Construct a one-sample t-interval for the mean difference .
You are not doing two-sample inference here. Once differences are calculated, it’s a one-sample problem.
3. Conditions for a One-Sample t-Interval
You must check independence and approximately normal sampling distribution.
Random
- Data from a random sample or random assignment
- On written responses, state where randomness came from in context.
Independence
- Observations must be independent.
- If sampling without replacement, check the 10% condition:
In words: it’s reasonable to believe the population is at least 10 times the sample size.
Say it in context, like:
“It is reasonable to believe there are at least 10n students at the school.”
Nearly Normal (Shape)
We need the sampling distribution of to be approximately normal.
- If n ≥ 30 → OK (Central Limit Theorem)
- If n < 30:
- No strong skewness
- No outliers
Small sample + strong skew or outliers → do not use t procedures.
4. Constructing the Confidence Interval
All confidence intervals follow:
Point Estimate
For a mean:
Standard Error
This measures how much would vary from sample to sample.
Critical Value
- with df =
- Found using a t-table or calculator (invT or TInterval)
Higher confidence level → larger
Margin of Error
Full Formula
You don’t need to memorize this. Build it from statistic ± (critical value × SE).
5. Interpreting the Confidence Interval
Correct wording matters.
Proper interpretation:
“I am 95% confident that the true population mean of [context] is between [lower] and [upper].”
Must include:
- Confidence level
- Context
- Clear reference to the true population mean
What 95% confident means:
If we took many random samples and built intervals this way, about 95% of those intervals would capture the true .
The parameter is fixed. The interval changes.
Never say:
“There is a 95% probability that is in this interval.”
What Makes an Interval Wider?
Since
Wider interval if:
- Higher confidence level
- Larger variability
- Smaller sample size
Larger shrinks the interval because it reduces the standard error.
Key Takeaways
Degrees of Freedom
The number of independent values that can vary after estimating a parameter; for one sample, n - 1.
One-Sample t-Interval for a Mean
The confidence interval procedure for estimating a population mean when σ is unknown.
Matched Pairs t-Interval
A mean interval found by analyzing pairwise differences as one sample of differences.
Point Estimate for a Population Mean
The sample mean x̄, used as the center of the confidence interval.
Standard Error of the Sample Mean
The estimated standard deviation of x̄, calculated as s divided by the square root of n.
Critical Value t*
The cutoff from a t-distribution for a chosen confidence level and n - 1 degrees of freedom.
Margin of Error for a One-Sample t-Interval
The amount added and subtracted from x̄, equal to t* times s divided by √n.
Confidence Interval Formula for a Population Mean
x̄ ± t*(s/√n), used when estimating μ with unknown population standard deviation.
Interpreting a Confidence Interval for μ
State that you are a given percent confident the true population mean lies between the interval endpoints.
t-Distribution
A bell-shaped distribution with heavier tails than normal that approaches normal as df increases.
Conditions for a One-Sample t-Interval
Use this method when data are random, independent, and the sample distribution is approximately normal.
Confidence Level
The long-run percent of intervals from this method that capture the true mean.
Notes
Degrees of Freedom
The number of independent values that can vary after estimating a parameter; for one sample, n - 1.
One-Sample t-Interval for a Mean
The confidence interval procedure for estimating a population mean when σ is unknown.
Matched Pairs t-Interval
A mean interval found by analyzing pairwise differences as one sample of differences.
Point Estimate for a Population Mean
The sample mean x̄, used as the center of the confidence interval.
Standard Error of the Sample Mean
The estimated standard deviation of x̄, calculated as s divided by the square root of n.
Critical Value t*
The cutoff from a t-distribution for a chosen confidence level and n - 1 degrees of freedom.
Margin of Error for a One-Sample t-Interval
The amount added and subtracted from x̄, equal to t* times s divided by √n.
Confidence Interval Formula for a Population Mean
x̄ ± t*(s/√n), used when estimating μ with unknown population standard deviation.
Interpreting a Confidence Interval for μ
State that you are a given percent confident the true population mean lies between the interval endpoints.
t-Distribution
A bell-shaped distribution with heavier tails than normal that approaches normal as df increases.
Conditions for a One-Sample t-Interval
Use this method when data are random, independent, and the sample distribution is approximately normal.
Confidence Level
The long-run percent of intervals from this method that capture the true mean.
