Topic 1.2 Notes – Geographic Data
What Geographic Data Is
Geographic data is any information tied to a place. A map shows it, but the data comes first.
- Spatial information tells you where something is.
- Examples: coordinates, street address, place name, census tract, parcel boundary
- Attribute information tells you what that place is like.
- Examples: population, income, language, land use, elevation, traffic, vegetation
Time matters too. A population count from 2010 and one from 2020 describe the same place at different moments, so geographers can measure change.
Geographic data can be quantitative or qualitative.
- Quantitative = numbers, like population density or rainfall
- Qualitative = descriptions, like residents explaining neighborhood identity
A common trap is treating a map as a collection method. Usually, a map is a display of data after it has been collected. In this topic, the key question is where did the data come from?
Main Ways Geographers Collect Data
Geographers first separate data by source.
Primary data
Primary data is collected directly for a specific investigation.
- The researcher decides when, where, and how to collect it.
- Examples:
- pedestrian counts
- water-quality testing
- surveys and interviews
- field photos
- GPS points
Strengths and limits:
| Primary data | What it means |
|---|---|
| Specific | Matches your exact question |
| Current | Usually reflects present conditions |
| Detailed | Can capture local conditions and lived experience |
| Costly | Takes time and money |
| Limited area | Hard to collect over huge areas |
Secondary data
Secondary data was collected earlier by someone else and reused.
- Examples:
- census data
- land records
- media reports
- policy documents
- published surveys
- satellite imagery
Secondary data is great for large areas and long time periods, but the categories or dates may not fit your question.
Field collection
Field collection means gathering information directly at a location.
- Methods include counts, measurements, surveys, interviews, field notes, sketches, photos, and coordinate recording.
- The U.S. decennial census is a standard example of organized field collection.
- A census tries to count everyone. A sample survey studies a selected subset and uses it to represent the larger population.
Written, oral, and visual sources
Some spatial data comes from records and interpretation, not direct measurement.
- Media reports can show where an event happened and how it affected people.
- Travel narratives help with historical landscapes and perceptions of place.
- Policy documents show laws, zoning, and planned land use.
- Personal interviews reveal experience, identity, and perception.
- Landscape analysis reads visible evidence in buildings, roads, fields, fences, or signs.
- Photographic interpretation looks inside an image for clues like pattern, shape, tone, texture, and association.
Geospatial Technologies
The exam expects you to separate four technologies clearly.
GIS
GIS stands for Geographic Information System. It stores, layers, analyzes, and displays spatial data.
Its signature move is overlaying layers to find relationships.
- Possible layers: roads, flood zones, land use, hospitals, population
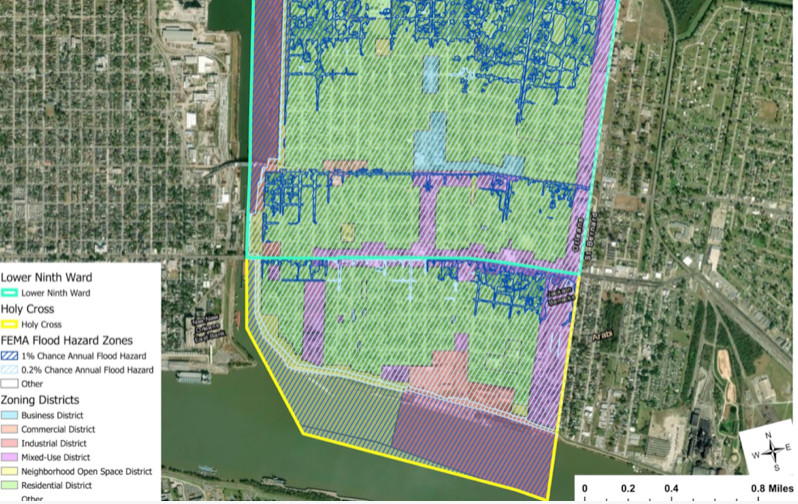
GIS overlay map of zoning and flood hazard layers
Satellite navigation systems
GPS is the best-known example. It uses satellite signals to calculate location.
- Gives coordinates, routes, and movement
- It tells you where you are
- It does not create images
Remote sensing
Remote sensing collects information about Earth from far away using satellites, aircraft, or drones.
- Used for land cover, deforestation, urban growth, crops, hazards
- Standard example: Landsat images over time
- Important terms:
- spatial resolution = how much detail each image cell shows
- temporal resolution = how often the same place is imaged
- ground truthing = checking image interpretations with field evidence
The Las Vegas time series below is the kind of remote sensing image set you may be asked to interpret. Focus on the satellite panels that show the city spreading outward over time.
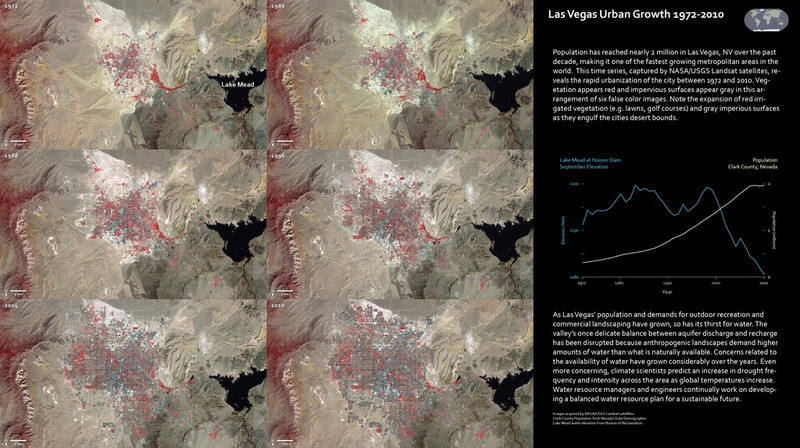
Landsat time series of Las Vegas urban growth
Online mapping and visualization
These are web-based interactive maps. They let users search, zoom, layer, and explore data. They often combine GIS, GPS, and remote sensing, and may include user-added information like road closures or geotagged uploads.
How to Tell the Methods Apart on the Exam
Match the clue to the method.
- Coordinates from orbiting satellites = satellite navigation
- Imagery from satellites, aircraft, or drones = remote sensing
- Layered analysis or overlays = GIS
- Interactive web map = online mapping
- Counts, surveys, measurements, interviews at a site = field collection
- News stories, laws, plans, diaries, agency records = documentary sources
- Buildings, roads, signs, fields used as evidence = landscape analysis
- Pattern, shape, tone, texture inside an image = photographic interpretation
One project can use several methods. The exam usually wants the specific function being described.
Limits, Verification, and Why Methods Are Combined
No dataset is perfect, so geographers care about:
- accuracy = closeness to reality
- precision = exactness
- resolution = level of detail
- currency = how recent it is
- completeness = what is missing
- consistency = same definitions and procedures
- representativeness = whether the sample reflects the larger group
- bias = systematic distortion
Common problems include census undercounts, weak survey samples, cloud cover in remote sensing, outdated online data, and interviews shaped by wording or interviewer effects.
Triangulation means using multiple methods or sources to strengthen a conclusion. Ground truthing is more specific. It means checking remote sensing or mapped interpretations with field evidence. That’s why the best method depends on the question. High-tech tools are useful, but they do not automatically give better evidence.
Key Takeaways
Geographic Data
Information tied to a location, commonly combining spatial or locational information about where something is with attribute information about its characteristics
Primary Data
Data collected directly for a particular investigation, with the investigator controlling at least part of the collection process
Secondary Data
Data originally collected by someone else and reused for a new investigation or purpose
Fieldwork (Field Data Collection)
Direct collection or verification of information at a location through observations, counts, measurements, surveys, interviews, photographs, field notes, or coordinate recording
Census
An organized attempt to collect standardized information from every member or household of a population
Sample Survey
A survey of a selected part of a population used to represent the larger population
Field Observations
Written, visual, or measured records made while investigating a place, including where, when, and under what conditions observations occurred
Media Reports
News, broadcasts, websites, and other media accounts used as sources of information about events and places
Travel Narratives
Travelers’ journals, diaries, memoirs, guidebooks, and other descriptions used as evidence about places, routes, and perceptions
Policy Documents
Laws, plans, regulations, zoning codes, reports, and proposals showing how organizations classify, regulate, or intend to change space
Personal Interviews
Questions asked of people to gather their experiences, knowledge, perceptions, and explanations about places or geographic processes
Landscape Analysis
The use of visible natural features and human modifications as evidence about land use, settlement, culture, and change
Photographic Interpretation
Analyzing visible clues in photographs or images, such as shape, pattern, texture, shadow, location, and association, to identify geographic features
Geospatial Technologies
Technologies that collect, locate, store, analyze, or display data connected to Earth’s surface
Geographic Information System (GIS)
A computer-based system that stores, manages, analyzes, and displays geographically referenced data as comparable spatial layers
Satellite Navigation System
A system that uses timed signals from orbiting satellites to calculate a receiver’s location, usually as latitude and longitude and sometimes elevation
Global Positioning System (GPS)
The United States’ satellite navigation system, commonly used to calculate and record a receiver’s location
Remote Sensing
Collecting information about Earth’s surface from a distance, without direct contact, using sensors on satellites, aircraft, or drones
Spatial Resolution
The size of the area represented by each image cell; finer spatial resolution reveals smaller features
Temporal Resolution
How often a remote-sensing system records the same location
Online Mapping and Visualization
Web-based or networked platforms that let users search for places, select layers, change displays, obtain directions, examine imagery, and interact with mapped spatial information
Volunteered Geographic Information
Geographic data contributed by users, such as place names, road reports, geotagged photographs, or observations added to collaborative maps
Triangulation
Using multiple independent sources or methods to examine the same condition and strengthen geographic evidence
Ground Truthing
Using field evidence to verify interpretations made from remotely sensed imagery or mapped data
Notes
Geographic Data
Information tied to a location, commonly combining spatial or locational information about where something is with attribute information about its characteristics
Primary Data
Data collected directly for a particular investigation, with the investigator controlling at least part of the collection process
Secondary Data
Data originally collected by someone else and reused for a new investigation or purpose
Fieldwork (Field Data Collection)
Direct collection or verification of information at a location through observations, counts, measurements, surveys, interviews, photographs, field notes, or coordinate recording
Census
An organized attempt to collect standardized information from every member or household of a population
Sample Survey
A survey of a selected part of a population used to represent the larger population
Field Observations
Written, visual, or measured records made while investigating a place, including where, when, and under what conditions observations occurred
Media Reports
News, broadcasts, websites, and other media accounts used as sources of information about events and places
Travel Narratives
Travelers’ journals, diaries, memoirs, guidebooks, and other descriptions used as evidence about places, routes, and perceptions
Policy Documents
Laws, plans, regulations, zoning codes, reports, and proposals showing how organizations classify, regulate, or intend to change space
Personal Interviews
Questions asked of people to gather their experiences, knowledge, perceptions, and explanations about places or geographic processes
Landscape Analysis
The use of visible natural features and human modifications as evidence about land use, settlement, culture, and change
Photographic Interpretation
Analyzing visible clues in photographs or images, such as shape, pattern, texture, shadow, location, and association, to identify geographic features
Geospatial Technologies
Technologies that collect, locate, store, analyze, or display data connected to Earth’s surface
Geographic Information System (GIS)
A computer-based system that stores, manages, analyzes, and displays geographically referenced data as comparable spatial layers
Satellite Navigation System
A system that uses timed signals from orbiting satellites to calculate a receiver’s location, usually as latitude and longitude and sometimes elevation
Global Positioning System (GPS)
The United States’ satellite navigation system, commonly used to calculate and record a receiver’s location
Remote Sensing
Collecting information about Earth’s surface from a distance, without direct contact, using sensors on satellites, aircraft, or drones
Spatial Resolution
The size of the area represented by each image cell; finer spatial resolution reveals smaller features
Temporal Resolution
How often a remote-sensing system records the same location
Online Mapping and Visualization
Web-based or networked platforms that let users search for places, select layers, change displays, obtain directions, examine imagery, and interact with mapped spatial information
Volunteered Geographic Information
Geographic data contributed by users, such as place names, road reports, geotagged photographs, or observations added to collaborative maps
Triangulation
Using multiple independent sources or methods to examine the same condition and strengthen geographic evidence
Ground Truthing
Using field evidence to verify interpretations made from remotely sensed imagery or mapped data
