Topic 1.3 Notes – The Power of Geographic Data
What the Power of Geographic Data Is
Geographic data and geospatial data both mean information tied to place. That can be a map, a census table, satellite image, GPS point, or GIS layer.
What makes the data powerful is not the picture itself. The power comes from what people do with it.
The core chain looks like this:
- Data shows a spatial pattern
- A person, business, or government interprets it
- A decision gets made
- Places and populations are affected differently
This chain runs at every scale: an individual picking a route, a business choosing a store site, a city drawing school zones, a national government directing disaster aid, or an international agency tracking displacement across borders.
A navigation app is a good quick example. It uses GPS-based geographic data to detect congestion, suggests a faster route, drivers follow it, and traffic shifts onto different roads. That changes accessibility, noise, business traffic, and commute times.
AP exam trap: don’t stop at naming the data source. You need the geographic effect. Say how the decision changes migration, development, representation, hazard exposure, traffic, or resource distribution. The same data can support different choices if the goal is profit, safety, equity, efficiency, or political advantage.
Main Types of Geographic Data and Tools
Census data
A census is an official population count plus demographic and socioeconomic details like age, race, income, housing, and education. It is tied to units such as states, counties, tracts, and districts.
- In the U.S., the decennial census happens every 10 years and is required by the Constitution.
- It is used for House reapportionment and then redistricting.
- It also guides funding, schools, roads, utilities, and public services.
If a community is undercounted, it can lose representation and money even if lots of people actually live there.
Satellite imagery and remote sensing
Remote sensing means collecting data without direct contact. Satellite imagery is great for showing change over time.
- It can show urban growth, deforestation, flooding, wildfire damage, and crop conditions.
- In the Amazon, it helps monitor deforestation so governments or NGOs can target enforcement.
- After disasters, before-and-after images help direct rescue and relief.
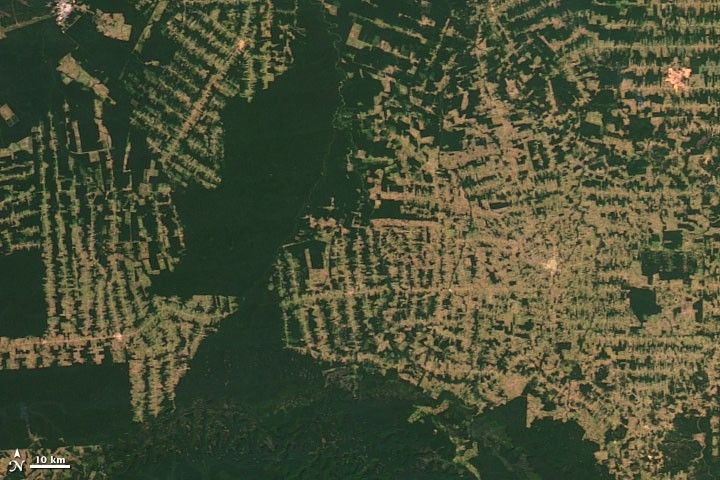
Amazon deforestation in satellite imagery
This satellite view shows the classic fishbone pattern of clearing spreading outward from roads. That kind of pattern is exactly why remote sensing is so useful for tracking land-use change over time.
Limits matter. Clouds, bad timing, and low resolution can hide what’s happening. An image may show damage, but not who needs medicine or shelter.
GIS
GIS is a computer system for storing, layering, analyzing, and displaying spatial data.
Its strength is layered analysis. You can combine roads, population, hazards, clinics, and land parcels to choose the best site for a school or emergency center.
- Vector data uses points, lines, and polygons
- Raster data uses grid cells
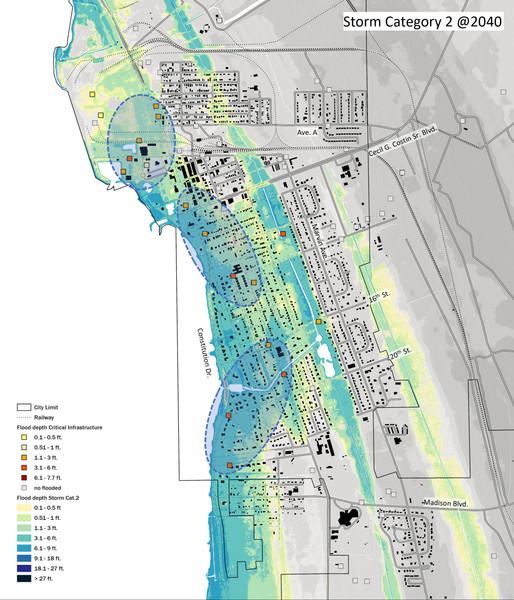
GIS flood-risk overlay map
This map is a good example of GIS in practice. It layers flood depth with streets, buildings, rail lines, and critical infrastructure so planners can see which places face the highest storm risk.
GPS and satellite navigation
GPS finds location. GIS analyzes location data. Students mix these up a lot.
GPS is used for routing, deliveries, transit, and emergency responders. Navigation apps can reroute drivers, which then changes neighborhood traffic patterns.
Who Uses Geographic Data and What Decisions They Make
Personal decisions
People use geographic data to choose routes, homes, nearby services, and evacuation paths. If many people make the same choice, the effect scales up. Homebuyers using school-quality or flood-risk maps can push demand and prices toward some neighborhoods and away from others.
Business and organizational decisions
Businesses use data for site selection, logistics, market analysis, and ads. A grocery store might choose a site based on population, income, traffic, and competitors. That can create jobs and food access, but also raise land values and increase truck traffic.
Nonprofits use similar tools after disasters to decide where aid centers should go.
Government decisions
Governments use data for redistricting, transit routes, zoning, school zones, hazard planning, and environmental monitoring. These effects are often broad and long-lasting because governments control boundaries, funding, and land use.
How to Explain Geographic Effects on the Exam
- Name the data source
- Describe the spatial pattern it reveals
- Identify the decision-maker and purpose
- State the decision
- Explain the spatial outcome
- Say who benefits and who is disadvantaged
Good pattern words include clusters, concentrations, gaps, corridors, proximity, regional contrasts, and change over time.
Strong effect language includes redirects traffic, increases access, concentrates investment, shifts development, redraws boundaries, redistributes aid, and changes hazard exposure.
Spatial association does not prove causation. A map can show two things in the same place, but you need evidence before claiming one caused the other.
Limits, Bias, and Unequal Effects
Geographic data can be incomplete, outdated, misclassified, or too broad. Large units like counties can hide neighborhood-level differences.
Problems include:
- census undercounts
- incorrect location records
- weak satellite resolution
- flawed GIS assumptions
- boundaries or categories that help some groups more than others
Privacy matters too. Location tracking can improve services and safety, but it can also allow surveillance.
Key Takeaways
Geographic Data
Information about places and the population, economic, environmental, or other characteristics associated with them
Geospatial Data
Data explicitly connected to locations on Earth, allowing users to examine where phenomena occur and how they are spatially related
Census Data
Population and demographic or socioeconomic information collected through an official government count and linked to geographic areas
Remote Sensing
The collection of information about an object or area without direct physical contact
Satellite Imagery
Data about Earth’s surface collected by sensors on satellites, often compared across time to detect conditions and change
Geographic Information System (GIS)
A computer-based system for capturing, storing, organizing, analyzing, and displaying location-linked data, often in layers
Vector Data
Spatial data representing discrete features as points, lines, and polygons
Raster Data
Spatial data that divides an area into a grid of cells, with each cell storing a value
Satellite Navigation System
A system that uses signals from satellites to determine a receiver’s location and time
Global Positioning System (GPS)
The United States’ satellite navigation system, commonly used to determine or record location and support navigation
Notes
Geographic Data
Information about places and the population, economic, environmental, or other characteristics associated with them
Geospatial Data
Data explicitly connected to locations on Earth, allowing users to examine where phenomena occur and how they are spatially related
Census Data
Population and demographic or socioeconomic information collected through an official government count and linked to geographic areas
Remote Sensing
The collection of information about an object or area without direct physical contact
Satellite Imagery
Data about Earth’s surface collected by sensors on satellites, often compared across time to detect conditions and change
Geographic Information System (GIS)
A computer-based system for capturing, storing, organizing, analyzing, and displaying location-linked data, often in layers
Vector Data
Spatial data representing discrete features as points, lines, and polygons
Raster Data
Spatial data that divides an area into a grid of cells, with each cell storing a value
Satellite Navigation System
A system that uses signals from satellites to determine a receiver’s location and time
Global Positioning System (GPS)
The United States’ satellite navigation system, commonly used to determine or record location and support navigation
