Topic 1.6 Notes – Scales of Analysis
What Scale of Analysis Is
Scale of analysis means the geographic unit at which data are organized and compared. The key word is unit. You are asking what each number, color, symbol, or category is attached to.
The four AP Human Geography scales are:
- Global = the world as a whole
- Regional = regions such as Southeast Asia, the Sahel, or provinces/states within a country
- National = countries
- Local = neighborhoods, villages, census tracts, municipalities, streets, or individual sites
This is where students get trapped. Scale of analysis is not the same thing as how much area a map shows. A world map can still be national if each value is attached to a country. A map of one country can still be local if it is divided into census tracts or neighborhoods.
Keep these three ideas separate:
- Geographic extent = how much area is covered
- Scale of analysis = what units the data use
- Cartographic scale = map ratio, like 1:25,000
The Four Scales of Analysis
Geographers use different scales because different questions need different units. This world map is a good reminder that a map can have global extent but still use national units, since each shaded value is attached to a country.
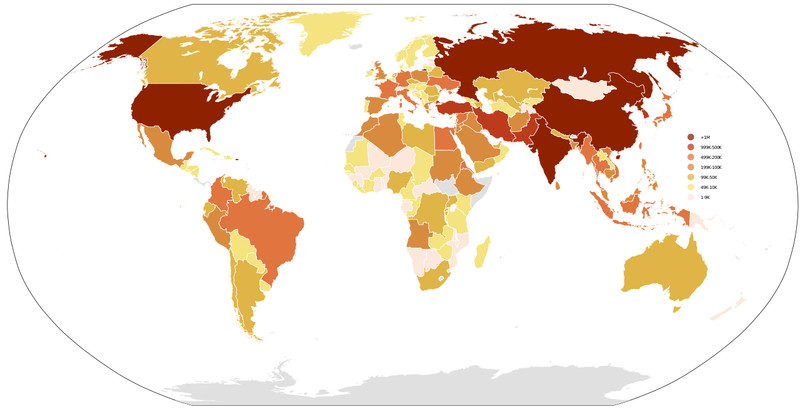
World choropleth with national-scale analysis
| Scale | What the unit is | Good for showing | Main limitation |
|---|---|---|---|
| Global | One world total or one worldwide system | Broad trends, global connections, disease spread, commodity chains | Hides differences inside regions and countries |
| Regional | Regions, continents, provinces, states, multicity areas | Internal divisions like coast vs. interior or core vs. periphery | Boundaries can be defined differently; local variation gets hidden |
| National | Countries | Comparing countries, laws, sovereignty, national policy | Hides urban-rural gaps, regional inequality, ethnic clustering |
| Local | Neighborhoods, villages, municipalities, tracts, sites | Clusters, inequality, immediate effects, who is affected | Cannot automatically be generalized outward |
Examples help lock this in:
- Global: total world population, worldwide urbanization, the global economy
- Regional: Sub-Saharan Africa, Latin America, provinces in China, a metro region
- National: fertility rate by country, GDP per capita by country
- Local: land use in one neighborhood, school access by census tract, conditions at a border crossing
How to Identify the Scale on the Exam
This is one of the most testable skills in the topic.
- Identify the phenomenon being shown. Maybe it is migration, population density, literacy, or water access.
- Identify the unit attached to each value. Is each color or number tied to a country, region, tract, or the whole world?
- Classify the unit:
- one worldwide total or world system = global
- regions, continents, provinces, states = regional
- countries = national
- counties, municipalities, neighborhoods, tracts, sites = local
- Ignore the map’s visual size until after you identify the units.
Common AP comparisons:
- World map by country = national
- World map by world region = regional
- One country split into provinces = regional
- One city split into census tracts = local
Useful clue words include by country, by province, by county, by tract, world total, and global network.
What Changing Scale Reveals
Changing scale changes the pattern you can see.
- Broader scales show large trends, long-distance connections, and comparisons among big units.
- Finer scales show internal variation, clusters, gaps, outliers, and unequal effects on communities.
Aggregation means combining smaller-unit data into a larger-unit value. That simplifies the pattern, but it can hide inequality. Disaggregation breaks data into smaller units, which reveals variation.
A classic example is Egypt. A national population density number makes Egypt look evenly summarized as one country. The map here makes the finer-scale pattern easier to see, with most people concentrated along the Nile River, the Nile Delta, and the Cairo area.
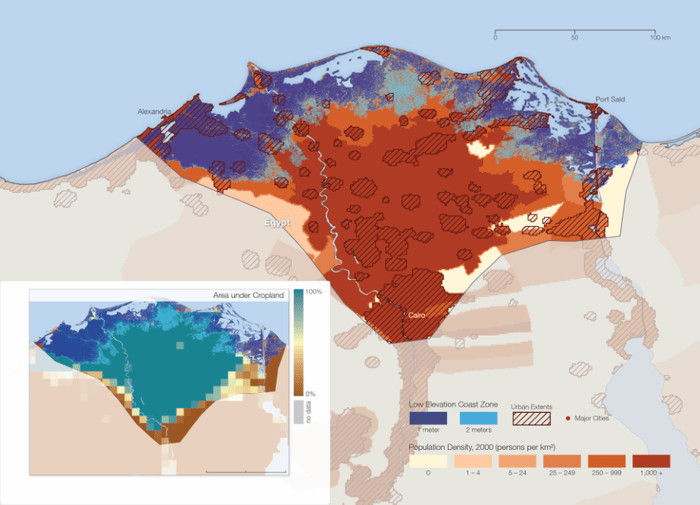
Population density and low-elevation zones in northern Egypt
A second example is a made-up country, Solana. A national water-access average can suggest moderate access overall, but regional data reveals a strong coast-versus-interior gap, and local data reveals differences between municipalities inside each region.
The rule you want in your head is simple. Your conclusion has to match the scale of the evidence.
Limits, Cross-Scale Effects, and Common Confusions
Processes often start at one scale and show effects at another.
- A global production network can change jobs in one town.
- A national housing policy can shape neighborhood development.
- A local land-use decision can add up to regional or global environmental change.
That is why geographers use multiscalar analysis, which means looking at the same issue at more than one scale.
No scale is automatically best. The right scale depends on the question. Boundaries matter too. If you redraw regions, the pattern can change even when the local data stays the same.
Key Takeaways
Scale of Analysis
The geographic level at which a pattern or process is studied and data are organized, summarized, or differentiated
Global Scale
Analysis that treats the world as a whole or examines a worldwide system
Regional Scale
Analysis that uses regions—such as world regions, groups of countries, states, provinces, or multicounty areas—as its geographic units
National Scale
Analysis that uses countries as its units, either examining one country as a whole or comparing countries
Local Scale
Analysis focused on small geographic units such as municipalities, villages, neighborhoods, census tracts, streets, or individual sites
Aggregation
Combining observations from smaller geographic units into a total, average, rate, or percentage for a larger unit, which conceals some internal variation
Disaggregation
Separating a larger value into its component geographic units to reveal clusters, gaps, outliers, inequalities, and other internal variation
Multiscalar Analysis
Examining a phenomenon at more than one scale to connect broad processes with their effects in particular places
Geographic Extent
The total area covered by a map or investigation, distinct from the geographic units used to organize its data
Cartographic Scale (Map Scale)
The mathematical relationship between distance on a map and the corresponding distance on Earth
Large-Scale Map vs. Small-Scale Map
A large-scale map has a smaller denominator, covers less area, and shows more detail; a small-scale map has a larger denominator, covers more area, and shows less detail
Notes
Scale of Analysis
The geographic level at which a pattern or process is studied and data are organized, summarized, or differentiated
Global Scale
Analysis that treats the world as a whole or examines a worldwide system
Regional Scale
Analysis that uses regions—such as world regions, groups of countries, states, provinces, or multicounty areas—as its geographic units
National Scale
Analysis that uses countries as its units, either examining one country as a whole or comparing countries
Local Scale
Analysis focused on small geographic units such as municipalities, villages, neighborhoods, census tracts, streets, or individual sites
Aggregation
Combining observations from smaller geographic units into a total, average, rate, or percentage for a larger unit, which conceals some internal variation
Disaggregation
Separating a larger value into its component geographic units to reveal clusters, gaps, outliers, inequalities, and other internal variation
Multiscalar Analysis
Examining a phenomenon at more than one scale to connect broad processes with their effects in particular places
Geographic Extent
The total area covered by a map or investigation, distinct from the geographic units used to organize its data
Cartographic Scale (Map Scale)
The mathematical relationship between distance on a map and the corresponding distance on Earth
Large-Scale Map vs. Small-Scale Map
A large-scale map has a smaller denominator, covers less area, and shows more detail; a small-scale map has a larger denominator, covers more area, and shows less detail
