Topic 2.9 Notes – Aging Populations
What an Aging Population Is
An aging population means the share of people age 65+ is rising. This is about the whole population’s composition, not just people living longer one by one.
A quick age-structure reminder:
- Youth dependents = ages 0-14
- Working-age population = ages 15-64
- Older dependents = ages 65+
You can recognize aging by these clues:
- Median age rises because the population is getting older overall.
- The elderly share grows compared with children and workers.
- The population pyramid gets a narrow base and looks more column-like or top-heavy than triangular.
The three population pyramids below show that shift over time. Focus on how the base narrows from 2000 to 2020 and how the middle and older age groups make up more of the population.
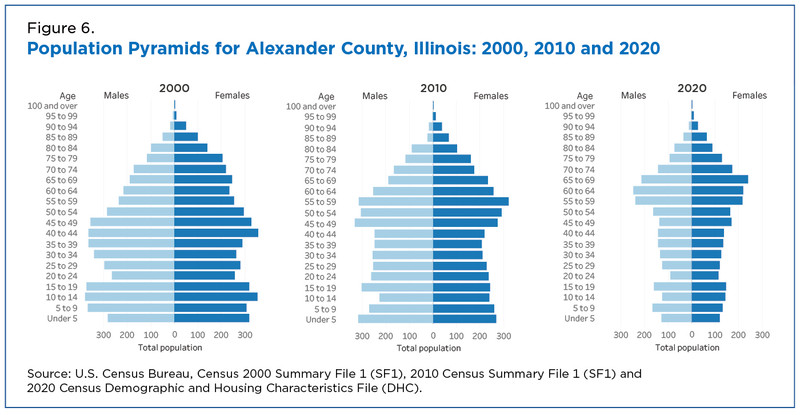
Population pyramids showing aging over time
Two pyramid details show up a lot on tests:
- A bulge in middle ages means a large cohort will soon retire, so aging will intensify.
- The oldest bars are often wider for women because women usually live longer.
This pattern fits late DTM stages, especially stage 4 and often stage 5. Keep one distinction clear: aging and population decline are related, but they are not the same thing.
What Causes Population Aging
Population aging comes from low birth rates, low death rates with long life expectancy, and cohort aging. Migration can change the speed.
Low birth rates
This is the most important long-term cause in many countries.
- Fewer births make the base of the pyramid smaller.
- Below-replacement fertility means fewer than about 2.1 children per woman, so younger generations may be smaller than older ones.
- Common reasons include urbanization, women’s education and jobs, contraception, later marriage, high child costs, and lower infant mortality.
The chain to know is simple:
- Low fertility → fewer children and future workers → older age structure
Longer life expectancy and mortality decline
Better sanitation, medicine, nutrition, and health care help more people survive into old age.
- In later DTM stages, lower mortality among older adults directly raises the elderly share.
- A common trap is the crude death rate. An old population can have high life expectancy and still have a rising crude death rate because more people are old enough to die in a given year.
Cohort aging
A cohort is a group born in the same period.
- A large generation moves through the pyramid together.
- A baby boom first raises youth dependency, then enlarges the labor force, then raises old-age dependency when that group retires.
Migration as a modifier
Migration usually does not cause aging by itself, but it can reshape it.
- Young adult in-migration can temporarily lower old-age dependency.
- Young adult out-migration often leaves rural areas older.
- Retirement migration can cluster elderly people in certain communities.
Measuring and Identifying Aging
These measures connect age structure to likely pressure on society and the economy.
What matters most:
- Aging usually raises the old-age dependency ratio.
- The total dependency ratio may not jump at first if fewer children offset more elderly people.
- An aging index above 100 means there are more elderly people than children.
- Best distinction to memorize: aging index compares old vs. young; dependency ratios compare dependents vs. workers.
National data can hide local patterns. Cities may stay younger, while rural areas age faster.
Consequences of Aging Populations
The core pattern is fewer workers per retiree and more demand for age-related services.
Economic effects
- Smaller younger cohorts plus retirement of large older cohorts can shrink the labor force.
- Results can include labor shortages, higher labor costs, slower growth, automation, delayed retirement, and foreign labor recruitment.
- Pensions face pressure, especially pay-as-you-go systems funded by current workers.
- Health-care and long-term-care costs rise.
- Consumer demand shifts toward eldercare, medicine, and accessible housing.
Social effects
- The sandwich generation may care for both children and elderly parents.
- Smaller families mean fewer adult children to share care.
- More elderly living alone increases need for community support.
- The built environment changes through walkable spaces, transit, accessible housing, nearby medical care, and assisted living.
Political effects
- Older adults often vote at higher rates, so pensions and health care gain political importance.
- That can create intergenerational debates over taxes and spending.
- Governments may respond with pronatalist policies, immigration reform, or a higher retirement age.
Country Examples
Japan
Japan is the classic APHG case. Its 2020 population pyramid shows exactly what students mean by a narrow base and an aging population.
- Very low fertility + high life expectancy
- Narrow-base pyramid
- High old-age dependency ratio
- Responses include robotics, automation, keeping older workers employed, and limited foreign labor
- Rural Japan is aging faster than major cities because young adults leave
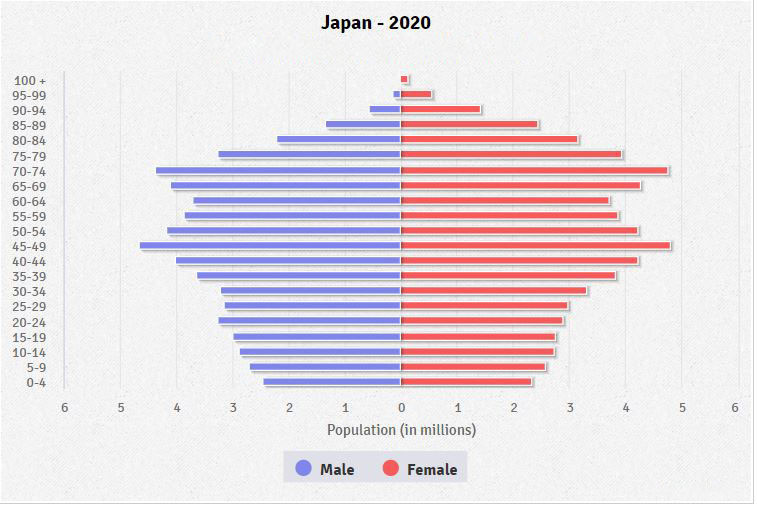
Japan population pyramid, 2020
China
China is aging quickly because of falling fertility, rising life expectancy, and the one-child policy.
- Younger cohorts are shrinking.
- Eldercare pressure is growing.
- The 4-2-1 family structure means one child may eventually support two parents and four grandparents.
A very common FRQ move is linking evidence to consequence:
- Narrow base → low fertility → fewer future workers
- Large upper bars → more elderly → pension and health-care pressure
- Rural youth out-migration → older remaining population → harder service provision
Key Takeaways
Population Aging
A demographic change in which older age groups make up an increasing share of the total population
Replacement-Level Fertility
The fertility needed for one generation to replace itself without migration, approximately 2.1 children per woman in many populations
Cohort Aging
The movement of a group born during the same period through the age structure, with a large cohort eventually increasing the elderly share
Dependency Ratio (Total Age Dependency Ratio)
[(population ages 0–14 + population ages 65 and older) ÷ population ages 15–64] × 100; age-defined dependents per 100 working-age people
Youth Dependency Ratio
(population ages 0–14 ÷ population ages 15–64) × 100; youth dependents per 100 working-age people
Old-Age Dependency Ratio
(population ages 65 and older ÷ population ages 15–64) × 100; older dependents per 100 working-age people
Aging Index
(population ages 65 and older ÷ population ages 0–14) × 100; a value above 100 means older people outnumber children
Feminization of Old Age
The tendency for women to form a majority of the oldest population because they generally have longer life expectancy than men
Sandwich Generation
Adults responsible for supporting both their children and their elderly parents
4-2-1 Family Structure
A simplified pattern in which one child is connected to two parents and four grandparents, illustrating how low fertility can concentrate eldercare expectations
Notes
Population Aging
A demographic change in which older age groups make up an increasing share of the total population
Replacement-Level Fertility
The fertility needed for one generation to replace itself without migration, approximately 2.1 children per woman in many populations
Cohort Aging
The movement of a group born during the same period through the age structure, with a large cohort eventually increasing the elderly share
Dependency Ratio (Total Age Dependency Ratio)
[(population ages 0–14 + population ages 65 and older) ÷ population ages 15–64] × 100; age-defined dependents per 100 working-age people
Youth Dependency Ratio
(population ages 0–14 ÷ population ages 15–64) × 100; youth dependents per 100 working-age people
Old-Age Dependency Ratio
(population ages 65 and older ÷ population ages 15–64) × 100; older dependents per 100 working-age people
Aging Index
(population ages 65 and older ÷ population ages 0–14) × 100; a value above 100 means older people outnumber children
Feminization of Old Age
The tendency for women to form a majority of the oldest population because they generally have longer life expectancy than men
Sandwich Generation
Adults responsible for supporting both their children and their elderly parents
4-2-1 Family Structure
A simplified pattern in which one child is connected to two parents and four grandparents, illustrating how low fertility can concentrate eldercare expectations
