Topic 2.1 Notes – Population Distribution
What Population Distribution Is
Population distribution means the spatial arrangement of people across Earth’s surface. Think location and pattern, not math. Population density is different. It gives a ratio of people to land.
The ecumene is permanently inhabited land. Non-ecumene means places with little or no permanent settlement, such as deserts, polar lands, some mountains, and parts of tropical rainforest.
The world’s biggest population concentrations formed where farming, transport, and cities could grow together:
- East Asia includes eastern China, Korea, and Japan. Dense settlement grew in coasts, river valleys, lowlands, and urban-industrial corridors.
- South Asia centers on the Indo-Gangetic Plain in India, Pakistan, and Bangladesh, where monsoon rains, fertile soils, and major rivers support huge populations.
- Southeast Asia concentrates in river deltas, coastal zones, and islands like Java, where ports, trade, and productive agriculture support dense settlement.
- Europe is a broad connected concentration shaped by moderate climate, navigable rivers, industrialization, and long settlement history.
- Eastern North America includes the Northeast U.S., Great Lakes, Atlantic seaboard, and southeastern Canada, where transport, industry, and urbanization pulled people in.
A world population density map makes those major clusters easy to spot, especially in East Asia, South Asia, Europe, and the eastern United States.
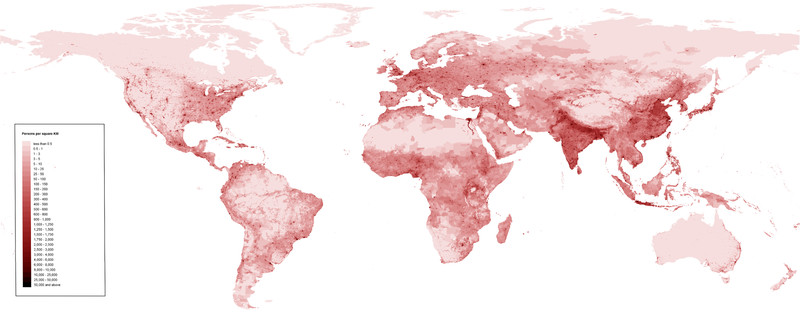
World population density map
Common settlement patterns:
- Clustered means people live close together, like in cities or compact villages.
- Dispersed means homes are spread out, common in farming areas.
- Linear means settlement follows a river, coast, road, or valley.
Classic sparse environments are dry lands, cold lands, wet tropical regions, and highlands. Textbook examples you should know are the Nile Valley and Delta, Ganges-Brahmaputra system, Huang He and Yangtze valleys, and Java.
Factors That Influence Where People Live
Population patterns almost always come from physical and human factors working together. AP Human Geography does not want environmental determinism, where nature alone “decides” everything.
Physical factors
- Climate shapes comfort, farming, and building costs. Temperate and subtropical areas usually attract more settlement than extreme cold, heat, or aridity.
- Water matters for drinking, irrigation, transport, trade, fishing, and hydroelectric power. That is why rivers, lakes, and coasts attract population.
- Landforms and elevation matter because lowlands, plains, and valleys are easier for farming, building, and transportation than mountains.
- Soil and vegetation affect agriculture. Fertile alluvial soils in floodplains and deltas support dense settlement. Rainforest soils are often less productive than students expect.
Examples make the mechanism clear:
- Egypt is concentrated along the Nile because the river provides water, irrigation, fertile soil, and a transport corridor.
- The Himalayas are sparsely settled because steep slopes, cold temperatures, and thin soils make settlement harder.
- The Andes show high elevation can still support population when people adapt culturally and economically.
Human factors
People also live where systems and opportunities pull them:
| Human factor | How it shapes distribution |
|---|---|
| Economic opportunity | Jobs in ports, industrial regions, mining zones, tourist centers, and service cities attract workers. |
| Transportation and infrastructure | Roads, rail, canals, ports, and airports create linear corridors and nodal growth. |
| History | Colonial ports, old capitals, and early agricultural hearths often stay population cores. |
| Culture | Kinship, religion, language, and ancestral ties keep people connected to particular places. |
| Politics | Borders, conflict, land policy, infrastructure spending, and capital placement can attract or push population. |
Scale of Analysis Changes the Explanation
The same place can look different depending on scale of analysis.
- Global scale shows broad patterns like concentration in coasts, lowlands, river valleys, and temperate/subtropical zones.
- Regional scale shows contrasts inside a world region, like the Indo-Gangetic Plain versus the Himalayas and Thar Desert.
- National scale highlights internal patterns, like Egypt’s strong Nile-centered settlement.
- Local scale explains neighborhood clustering through roads, transit, zoning, hazards, jobs, and water access.
This gets tested a lot. A national average can hide huge internal contrasts.
How Geographers Show and Measure Population
Distribution is usually mapped. Density is calculated.
Map types for distribution
- Dot map shows clusters well because each dot stands for a set number of people.
- Choropleth map shades units by density and is good for comparison, but it hides variation inside each unit.
- Cartogram resizes places by population, so it shows population share rather than land size.
A population cartogram makes that easy to see at a glance because countries with huge populations appear visually enlarged.
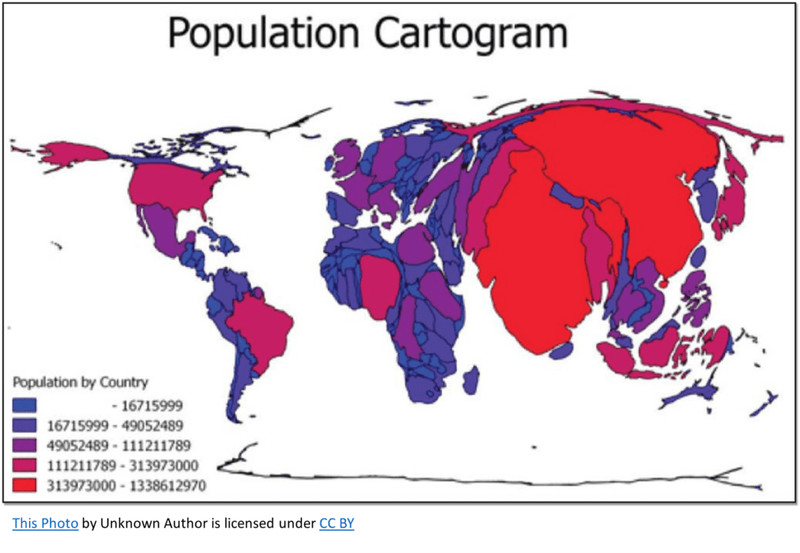
World population cartogram
The three density measures
- Arithmetic density = total population ÷ total land area
- Physiological density = total population ÷ arable land
- Agricultural density = number of farmers ÷ arable land
What each one tells you
- Arithmetic density gives a broad average, but it can hide the fact that much land is unusable.
- Physiological density shows pressure on farmland, so it is better for thinking about land available to feed people.
- Agricultural density shows how much labor is used on arable land. High values usually suggest labor-intensive farming. Low values often suggest mechanized farming.
Telling Distribution and Density Apart on the Exam
A distribution question asks where people are and what pattern they form. A density question asks what ratio is being measured and what land is in the denominator.
Two places can have the same arithmetic density and totally different distributions. High arithmetic density alone does not prove overcrowding or food shortage. High physiological density suggests stronger pressure on arable land. Low agricultural density often points to mechanized, capital-intensive farming.
Key Takeaways
Population Distribution
The locations where people live and the spatial pattern those settlements form
Population Density
A numerical relationship between a population and a specified area of land, distinct from the spatial arrangement of people
Ecumene and Non-Ecumene
The ecumene is Earth's permanently settled area; the non-ecumene has little or no permanent settlement
Clustered Distribution
A settlement pattern in which many people live close together, such as in a compact village or metropolitan area
Dispersed Distribution
A settlement pattern in which residences are spread across a relatively wide area
Linear Distribution
A settlement pattern that follows a feature such as a river, coast, road, or narrow valley
Scale of Analysis
The geographic unit at which data are differentiated or aggregated, such as global, regional, national, or local; not the map's total extent
Arithmetic Density
Total population ÷ total land area; measures average population concentration but treats all land as equivalent
Physiological Density
Total population ÷ arable land area; indicates potential population pressure on crop-producing land
Agricultural Density
Number of farmers ÷ arable land area; indicates agricultural labor intensity and often the degree of mechanization
Notes
Population Distribution
The locations where people live and the spatial pattern those settlements form
Population Density
A numerical relationship between a population and a specified area of land, distinct from the spatial arrangement of people
Ecumene and Non-Ecumene
The ecumene is Earth's permanently settled area; the non-ecumene has little or no permanent settlement
Clustered Distribution
A settlement pattern in which many people live close together, such as in a compact village or metropolitan area
Dispersed Distribution
A settlement pattern in which residences are spread across a relatively wide area
Linear Distribution
A settlement pattern that follows a feature such as a river, coast, road, or narrow valley
Scale of Analysis
The geographic unit at which data are differentiated or aggregated, such as global, regional, national, or local; not the map's total extent
Arithmetic Density
Total population ÷ total land area; measures average population concentration but treats all land as equivalent
Physiological Density
Total population ÷ arable land area; indicates potential population pressure on crop-producing land
Agricultural Density
Number of farmers ÷ arable land area; indicates agricultural labor intensity and often the degree of mechanization
