Topic 2.4 Notes – Population Dynamics
What Population Dynamics Are
Population dynamics means change in population size over time. At any scale, from a city to the whole world, the same three pieces drive change:
- Fertility adds people through births.
- Mortality removes people through deaths.
- Migration changes population through movement.
- Immigration adds people to a place.
- Emigration removes people from a place.
The core equation ties the whole topic together:
Two smaller pieces come out of that:
- Natural change = births - deaths
- Net migration = immigration - emigration
This is the exam trap to avoid. Total population change is not the same as natural increase. A place can grow even when deaths are higher than births if enough people move in. A place can shrink even with more births than deaths if even more people move out. Age structure from Topic 2.3 matters here, because crude rates can look misleading if a population is very young or very old.
The Main Population Measures
These measures let geographers compare places of different sizes.
Fertility
- Crude birth rate (CBR) = live births per 1,000 total population in one year
It is called crude because the denominator includes everyone, not just women who can have children. - Total fertility rate (TFR) = average number of children per woman over her lifetime.
This is better than CBR for comparing childbearing behavior. - Replacement-level fertility is about 2.1 children per woman in low-mortality countries.
- Population momentum means growth can continue even after fertility drops below replacement, because a large young generation is just entering childbearing years.
Mortality
- Crude death rate (CDR) = deaths per 1,000 total population in one year
A high CDR can happen in a rich, healthy country if it has many elderly people. - Infant mortality rate (IMR) = deaths under age 1 per 1,000 live births
IMR is a strong clue about health care, sanitation, nutrition, and development. - Life expectancy = average expected lifespan under current mortality conditions.
Growth
- Rate of natural increase (RNI)
- Net migration rate (NMR) = immigrants - emigrants per 1,000 population
- Total growth rate includes both natural increase and migration.
- Doubling time uses the Rule of 70
Use a percent, not a per-thousand rate.
What Changes Fertility, Mortality, and Migration
Population patterns make more sense once you connect them to conditions in real places.
- Economic factors
- In agricultural economies, children may provide labor and old-age support, which often raises fertility.
- In urban-industrial economies, children cost more, so fertility often falls.
- Jobs pull migrants in. Unemployment pushes people out.
- Social and cultural factors
- Women’s education, later marriage, workforce participation, and contraception usually lower fertility.
- Ideas about ideal family size, gender roles, and family duty shape birth rates.
- Education, sanitation knowledge, and maternal care lower mortality.
- Social networks create chain migration, making movement easier.
- Political factors
- Health care, vaccines, clean water, and public health systems lower mortality.
- War, persecution, and instability raise mortality and emigration.
- Governments can influence fertility and migration, though detailed population policy is covered later in the course.
- Environmental factors
- Droughts, floods, earthquakes, disease outbreaks, and food insecurity can raise mortality or trigger migration.
- The impact depends on how vulnerable a place is and how much the state can respond.
Historical and Regional Population Patterns
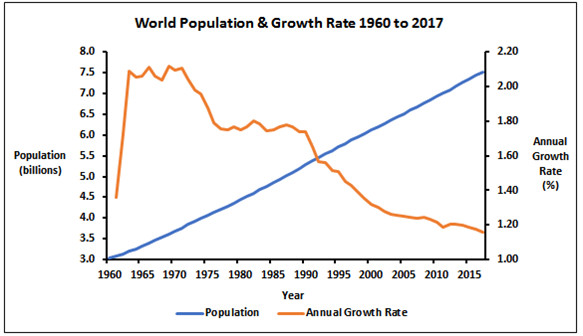
For most of history, both birth rates and death rates were high, so population grew slowly. Agriculture supported bigger settled populations, but famine and disease still kept growth in check. Industrialization and public health lowered death rates first, so natural increase sped up. The graph below matches that big-picture trend. World population keeps rising even after the annual growth rate peaks a little above 2 percent in the early 1960s and then declines as fertility falls.
Examples you should know:
| Place or event | Pattern |
|---|---|
| 1918 influenza pandemic | major mortality shock |
| COVID-19 pandemic | recent mortality shock |
| Ireland during the Great Famine | higher mortality, lower fertility, heavy emigration |
| Niger | high fertility, rapid natural increase |
| Japan | low fertility, aging population, natural decrease |
| Some European countries | low fertility offset by immigration |
| Persian Gulf states | growth driven largely by labor immigration |
How to Read Population Questions and Data
On a graph of CBR and CDR, focus on the distance between the birth-rate line and the death-rate line over time.
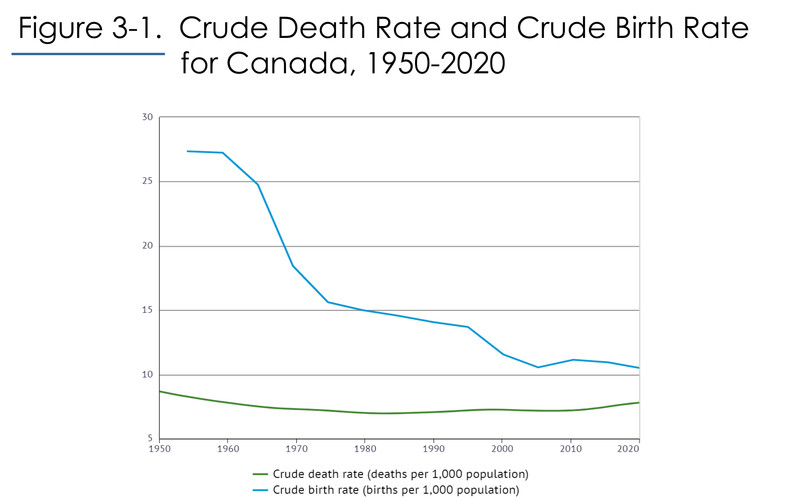
Crude birth rate and crude death rate over time
- The vertical gap between the lines shows natural increase.
- Converging lines mean growth is slowing.
- CDR above CBR means natural decrease.
On maps, remember this:
- RNI maps show births vs. deaths only.
- They do not show total growth if migration is changing the population a lot.
Key Takeaways
Population Dynamics
Change in a population’s size over time through fertility, mortality, and migration
Population-Balancing Equation
Population change = births − deaths + immigration − emigration
Crude Birth Rate (CBR)
Live births in one year per 1,000 total population: births ÷ midyear population × 1,000
Total Fertility Rate (TFR)
The average number of children a woman would have over her reproductive lifetime if current age-specific fertility patterns continued
Replacement-Level Fertility
The fertility level at which a generation replaces itself without migration, approximately 2.1 children per woman in low-mortality populations
Population Momentum
Continued population growth after fertility falls because a large young population is entering its reproductive years
Mortality
The occurrence of deaths within a population
Crude Death Rate (CDR)
Deaths in one year per 1,000 total population: deaths ÷ midyear population × 1,000
Infant Mortality Rate (IMR)
Deaths of children under age one per 1,000 live births in a year
Life Expectancy
The average number of years a newborn is expected to live if current mortality conditions continue
Migration
Permanent or semipermanent relocation that changes the populations of both an origin and a destination
Immigration vs. Emigration
Immigration is migration into a place and adds population; emigration is migration out of a place and removes population
Net Migration
The difference between immigration and emigration: immigrants − emigrants
Net Migration Rate (NMR)
Net migration per 1,000 population: (immigrants − emigrants) ÷ midyear population × 1,000
Natural Increase
The difference between births and deaths, excluding migration
Rate of Natural Increase (RNI)
Annual natural change as a percentage: (CBR − CDR) ÷ 10; it excludes migration
Total Annual Growth Rate
When component rates are per 1,000: (CBR − CDR + NMR) ÷ 10
Population-Doubling Time
The number of years required for a population to double if its annual percentage growth rate remains constant
Rule of 70
Estimated doubling time = 70 ÷ annual growth rate expressed as a percent
Fertility
Actual childbearing within a population
Notes
Population Dynamics
Change in a population’s size over time through fertility, mortality, and migration
Population-Balancing Equation
Population change = births − deaths + immigration − emigration
Crude Birth Rate (CBR)
Live births in one year per 1,000 total population: births ÷ midyear population × 1,000
Total Fertility Rate (TFR)
The average number of children a woman would have over her reproductive lifetime if current age-specific fertility patterns continued
Replacement-Level Fertility
The fertility level at which a generation replaces itself without migration, approximately 2.1 children per woman in low-mortality populations
Population Momentum
Continued population growth after fertility falls because a large young population is entering its reproductive years
Mortality
The occurrence of deaths within a population
Crude Death Rate (CDR)
Deaths in one year per 1,000 total population: deaths ÷ midyear population × 1,000
Infant Mortality Rate (IMR)
Deaths of children under age one per 1,000 live births in a year
Life Expectancy
The average number of years a newborn is expected to live if current mortality conditions continue
Migration
Permanent or semipermanent relocation that changes the populations of both an origin and a destination
Immigration vs. Emigration
Immigration is migration into a place and adds population; emigration is migration out of a place and removes population
Net Migration
The difference between immigration and emigration: immigrants − emigrants
Net Migration Rate (NMR)
Net migration per 1,000 population: (immigrants − emigrants) ÷ midyear population × 1,000
Natural Increase
The difference between births and deaths, excluding migration
Rate of Natural Increase (RNI)
Annual natural change as a percentage: (CBR − CDR) ÷ 10; it excludes migration
Total Annual Growth Rate
When component rates are per 1,000: (CBR − CDR + NMR) ÷ 10
Population-Doubling Time
The number of years required for a population to double if its annual percentage growth rate remains constant
Rule of 70
Estimated doubling time = 70 ÷ annual growth rate expressed as a percent
Fertility
Actual childbearing within a population
