Topic 1.7 Notes – Regional Analysis
What a region is
A region is an area linked by one or more unifying characteristics or by a pattern of activity. That characteristic could be physical, cultural, political, or economic. The activity could be commuting, trade, travel, or communication.
Geographers use regional analysis because the world is too complex to study place by place with no grouping. Regions help them compare areas, spot patterns, and explain why places are connected or different.
The part students miss most is this. Regions are geographic constructs. They are made by people for a purpose. Earth does not come pre-divided into one correct set of regions.
- The same land can be divided by state lines, climate, language, commuting patterns, or cultural identity.
- A region does not need to be uniform in every way. A language region can still have many religions, incomes, and landscapes inside it.
- On the exam, the move is simple. Ask yourself, what evidence is being used to define this area?
Types of regions
Different region types are about different kinds of unity.
Formal regions
A formal region is held together by a shared measurable or officially recognized trait. It is also called homogeneous or uniform.
Two common forms show up a lot:
- Administrative or political formal regions
Boundaries come from law or government. Illinois, U.S. states, counties, and cities fit here. - Statistical or trait formal regions
Boundaries come from data or thresholds. Climate regions, dominant language regions, and dominant religion regions fit here.
A climate map like this is a good example of a trait formal region. The regions are defined by shared climate characteristics.
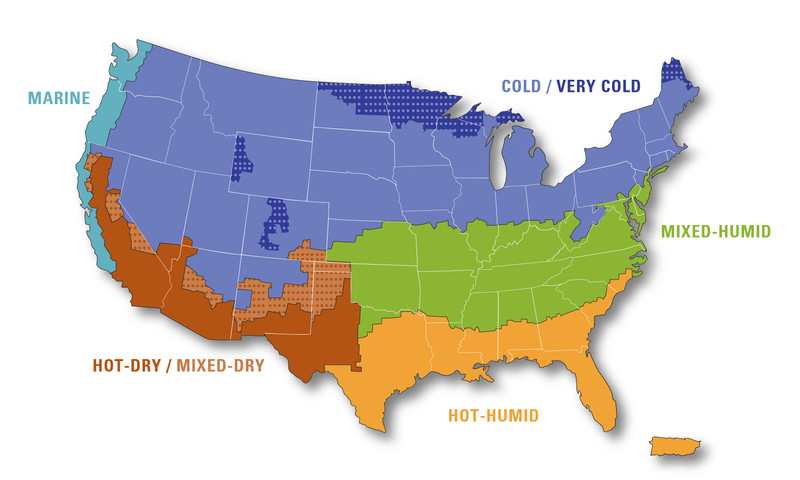
U.S. climate regions
Key clue: a formal region is unified by a common trait, not by a central hub.
Functional regions
A functional region is organized around a node or hub. It is also called a nodal region. What matters is interaction.
It has three parts:
- Node such as a city, airport, school, or hospital
- Hinterland/service area around it
- Flows connecting them, such as commuters, patients, flights, shoppers, or media signals
Examples include Chicago’s commuting region, airport hub networks, school zones, and hospital service areas.
Key clue: membership depends on connections and movement.
Perceptual regions
A perceptual region is based on shared beliefs, identity, or reputation. It is also called a vernacular region.
Examples:
- The South
- The Midwest
- The Bible Belt
- The Rust Belt
- Downtown
These come from mental maps, surveys, local use, media, and self-identification. People recognize them, but the line is fuzzy.
How to tell the three types apart
Ask what creates the region’s unity.
| If the evidence shows... | Region type |
|---|---|
| shared trait or legal boundary | Formal |
| flows centered on a node | Functional |
| identity or popular recognition | Perceptual |
The same place can fit all three:
- Chicago in Illinois = formal
- Chicago metro commuting area = functional
- Chicago in the Midwest = perceptual
A label alone does not tell you the type. An “urban region” could be formal, functional, or perceptual depending on the evidence. Regions can also be nested at different scales, like city inside county inside state, while also belonging to a metro area and a vernacular region.
Regional boundaries
Boundaries mark where the defining trait, activity, or perception changes or fades.
- Some are sharp, like many political borders on maps, though even those can be contested.
- Many are transitional. Climate, language, religion, and culture often change gradually.
- Functional boundaries usually weaken outward because of distance decay. Farther places interact less with the node.
- Perceptual boundaries are often the fuzziest. There is usually a core and a fringe, like debates over whether Kentucky or Texas is “the South.”
Remember these boundary words: transitional, overlapping, dynamic, contested.
Using regional analysis at different scales
Geographers build regions by matching the method to the question.
- Identify the phenomenon being studied.
- Choose the scale, such as local, national, or global.
- Choose the basis for the region.
- Gather evidence, such as census data, commuting flows, or surveys.
- Draw and interpret the boundary.
- Recognize limits from scale, time, and criteria.
Examples by scale:
- Local: neighborhoods, downtown, school zones, hospital service areas
- National: states, agricultural belts, language regions, the South
- Global: climate zones, language regions, trade networks, broad cultural regions
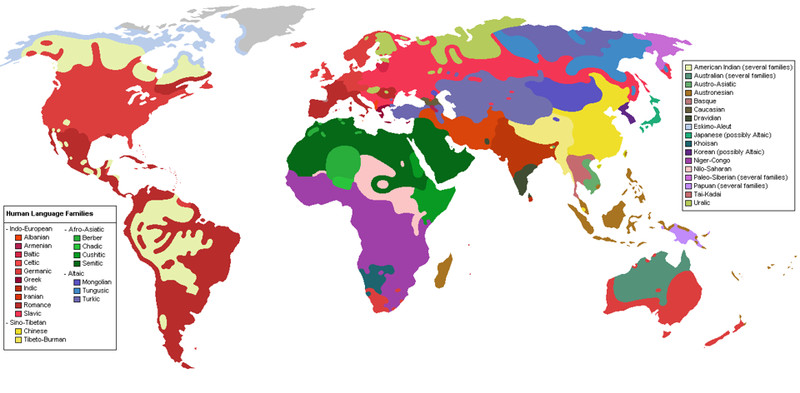
World map of major language families
This world map is a good example of global-scale regional analysis. It groups places by language families to show broad cultural patterns across continents.
Scale matters a lot. A state-level map can hide patterns that county-level data reveals.
Key Takeaways
Regional Analysis
Organizing space into regions to describe and interpret geographic patterns
Region
An area identified by one or more unifying characteristics or by a pattern of activity
Formal Region / Homogeneous Region / Uniform Region
A region defined by one or more shared, observable characteristics that distinguish it from surrounding areas
Functional Region / Nodal Region
A region organized around a node and unified by flows and interactions between that node and its surrounding area
Perceptual Region / Vernacular Region
A region defined by shared beliefs, feelings, identities, or ideas about an area
Regional Boundary
The limit of the characteristic, activity, or perception defining a region; it may be precise, transitional, overlapping, dynamic, or contested
Notes
Regional Analysis
Organizing space into regions to describe and interpret geographic patterns
Region
An area identified by one or more unifying characteristics or by a pattern of activity
Formal Region / Homogeneous Region / Uniform Region
A region defined by one or more shared, observable characteristics that distinguish it from surrounding areas
Functional Region / Nodal Region
A region organized around a node and unified by flows and interactions between that node and its surrounding area
Perceptual Region / Vernacular Region
A region defined by shared beliefs, feelings, identities, or ideas about an area
Regional Boundary
The limit of the characteristic, activity, or perception defining a region; it may be precise, transitional, overlapping, dynamic, or contested
