Topic 1.6 Notes – Photoelectron Spectroscopy
1. What Photoelectron Spectroscopy Shows
PES is based on the photoelectric effect. A photon hits an atom and ejects an electron. By measuring how much energy it took to remove that electron, scientists determine its binding energy.
Think of binding energy as how tightly an electron is held by the nucleus.
Each peak in a PES spectrum corresponds to electrons in a specific subshell:
- 1s
- 2s
- 2p
- 3s, etc.
Two things every PES graph tells you:
- Peak position (x-value) → binding energy
- Higher binding energy = electron held more tightly.
- Peak height (or area) → number of electrons in that subshell.
If you know electron configuration and understand attraction between positive nuclei and negative electrons, PES becomes very logical.
2. How to Read a PES Graph
a. The Axes
Here’s what a typical PES spectrum looks like:
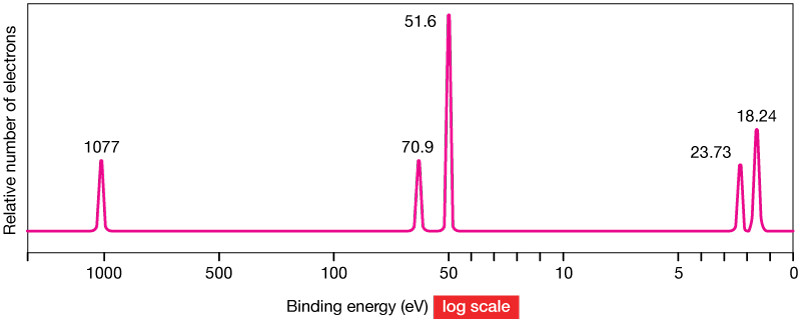
Example photoelectron spectrum (PES)
Important details:
- x-axis = Binding energy
- In this graph, binding energy increases from right to left and is shown on a log scale.
- Left side = higher binding energy = electrons closer to nucleus.
- y-axis = Relative number of electrons
- Taller peak = more electrons in that subshell.
Always check which direction binding energy increases. AP questions love flipping axes.
b. What Each Peak Represents
Each peak corresponds to a subshell, not just a shell.
Subshell capacities:
- s → 2 electrons
- p → 6 electrons
- d → 10 electrons
- f → 14 electrons
If one peak is three times taller than another, it likely represents three times as many electrons.
Patterns to remember:
- 1s peak is always at the highest binding energy, which appears on the far left of a graph like this.
- Within the same principal energy level:
- s electrons have slightly higher binding energy than p electrons because they penetrate closer to the nucleus and feel stronger attraction.
c. Connecting Peaks to Electron Configuration
When identifying an element from PES:
- Start at highest binding energy (far left).
- Assign the first peak to 1s.
- Use peak height to determine number of electrons.
- Move to lower binding energies (2s, 2p, 3s…).
- Add total electrons and match to atomic number.
Example logic:
If you see three peaks with relative heights 2 : 2 : 4
That suggests:
Total electrons = 8 → oxygen.
On tests, they often won’t tell you the element. You’re expected to figure it out from the spectrum.
3. What Determines Binding Energy
Binding energy depends on the strength of attraction between the nucleus and the electron.
a. Distance from the Nucleus
- Electrons closer to nucleus → stronger attraction → higher binding energy.
- Core electrons have much higher binding energy than valence electrons.
Core peaks appear on the left. Valence peaks appear on the right.
b. Nuclear Charge and Coulomb’s Law
Coulomb’s law tells us:
- More positive charge → stronger attraction.
- Shorter distance → stronger attraction.
So as the number of protons increases, electrons are generally held more tightly.
Across a period, comparable subshell electrons usually show increasing binding energy due to increased nuclear charge.
c. Shielding
Inner electrons block some nuclear attraction from reaching outer electrons.
- Valence electrons experience reduced effective nuclear charge.
- That’s why their binding energies are much lower.
When explaining shifts in peak position, use:
- Nuclear charge
- Distance
- Shielding
That trio explains almost everything.
4. PES and Ions
PES also works for ions.
a. Cations
If an atom loses electrons:
- Electron-electron repulsion decreases.
- Remaining electrons feel stronger attraction.
- Binding energies increase.
Peaks shift toward higher binding energy. A peak may disappear if that subshell was emptied.
b. Anions
If an atom gains electrons:
- Repulsion increases.
- Electrons are slightly easier to remove.
- Binding energies decrease slightly.
On conceptual questions, they often ask which species has higher binding energy. The answer usually connects to nuclear charge and electron repulsion.
5. Big Patterns to Lock In
- Each peak = one subshell.
- Peak position → energy required to remove electron.
- Peak height → number of electrons.
- Left side = core electrons.
- Right side = valence electrons.
- s subshell peaks appear slightly left of p in same energy level.
- PES lets you determine:
- Electron configuration
- Number of valence electrons
- Relative attraction between electrons and nucleus
When you explain a PES trend, always tie it back to Coulombic attraction. That’s what earns points on free-response questions.
Key Takeaways
Photoelectron Spectroscopy (PES)
A technique that measures electron binding energies by ejecting electrons with high-energy photons.
Binding Energy
The energy required to remove an electron from an atom, ion, or subshell.
Ground-State Electron Configuration from PES
Assign peaks to subshells by binding energy and use peak sizes to count electrons.
Photoelectric Effect and PES
Photons eject electrons only if they provide enough energy to overcome the electrons' binding energies.
Interpreting a Photoelectron Spectrum
A graph where each subshell forms a peak whose position shows binding energy and height shows electron count.
Electron-Nucleus Attraction in PES
Electrons closer to the nucleus have higher binding energies than valence electrons because attraction is stronger.
Notes
Photoelectron Spectroscopy (PES)
A technique that measures electron binding energies by ejecting electrons with high-energy photons.
Binding Energy
The energy required to remove an electron from an atom, ion, or subshell.
Ground-State Electron Configuration from PES
Assign peaks to subshells by binding energy and use peak sizes to count electrons.
Photoelectric Effect and PES
Photons eject electrons only if they provide enough energy to overcome the electrons' binding energies.
Interpreting a Photoelectron Spectrum
A graph where each subshell forms a peak whose position shows binding energy and height shows electron count.
Electron-Nucleus Attraction in PES
Electrons closer to the nucleus have higher binding energies than valence electrons because attraction is stronger.
