Topic 5.10 Notes – Multistep Reaction Energy Profile
1. What a Multistep Reaction Energy Profile Is
A multistep reaction energy profile is a graph that shows how potential energy changes as reactants turn into products through multiple elementary steps.
- y-axis: Potential energy
- x-axis: Reaction coordinate (progress of reaction, not time)
- Each “hill” represents one elementary step in the mechanism.
If you know:
- The activation energy (Ea) for each step, and
- The energy change (ΔE or ΔH) for each step,
you can build the entire diagram.
This connects three ideas you’ve already seen:
- Mechanisms break a reaction into elementary steps.
- Each step has its own Ea.
- The overall reaction has one total ΔE from reactants to products.
The energy profile puts all of that into one visual.
2. Parts of a Multistep Energy Diagram
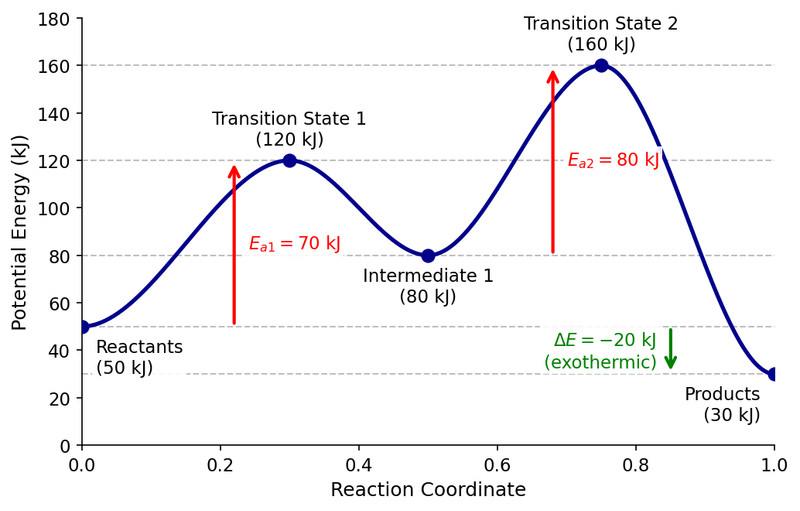
Here’s what you should instantly recognize on any diagram. As you look at this example, match each label to the definitions below.
Reactants
- Left side of the graph.
- Starting potential energy (here 50 kJ).
Products
- Right side of the graph.
- Final potential energy (here 30 kJ).
- Compare heights:
- Products lower → exothermic (ΔE < 0)
- Products higher → endothermic (ΔE > 0)
Transition States
- The peaks (120 kJ and 160 kJ in this example).
- One per elementary step.
- Highest-energy, unstable arrangements of atoms.
- Never isolated.
Intermediates
- The valleys between peaks (80 kJ here).
- Formed in one step, used up in the next.
- Appear in the mechanism.
- Do not appear in the overall balanced equation.
Activation Energy for Each Step
For each step, measure from a valley up to the next peak:
In the diagram:
Each step has its own activation energy.
Overall Energy Change
Now compare the very beginning and the very end:
Here:
That value does not depend on how many steps there are.
3. How to Construct a Multistep Energy Profile
Suppose you’re given:
- Step 1: ,
- Step 2: ,
Here’s how you’d build it:
- Place reactants at some starting energy (say 0 kJ for convenience).
- Step 1:
- Draw a peak 60 kJ above reactants.
- Drop 15 kJ above reactants (intermediate at +15 kJ).
- Step 2:
- From +15 kJ, draw a peak 90 kJ higher (at +105 kJ).
- Drop 40 kJ from +15 kJ → products at −25 kJ.
- Check total ΔE:
- Matches final position relative to start.
Always remember:
- Number of peaks = number of steps.
- Number of intermediates = steps − 1.
- Overall ΔE = sum of individual ΔE values.
Students often forget that each Ea is measured from the previous valley, not from the original reactants.
4. The Rate-Determining Step
In multistep reactions, one step controls the overall rate.
The rate-determining step (RDS) is the step with the largest activation energy, measured from its own preceding valley (reactant or intermediate) to its transition-state peak.
From the earlier diagram:
Step 2 is slower → it’s the RDS.
Important nuance:
You compare Ea values step-by-step. The tallest peak overall is not automatically the RDS unless it also represents the largest barrier relative to its starting valley.
On tests, they love giving you a diagram and asking which step limits the rate. Look at the vertical distance from each valley to its next peak. That’s the only thing that matters.
5. Connecting Energy Profiles to Mechanisms and Thermodynamics
An energy diagram tells you both kinetics and thermodynamics.
From the diagram you can determine:
- Number of elementary steps
- Number of intermediates
- Which step is slowest (largest Ea)
Thermodynamics comes from start vs. finish:
- Reactants higher than products → exothermic
- Reactants lower than products → endothermic
A reaction can be:
- Thermodynamically favorable (negative ΔE)
- But kinetically slow (large Ea)
That distinction shows up constantly in AP multiple choice and explanation questions.
Energy diagrams separate:
- ΔE → stability difference
- Ea → speed of reaction
Key Takeaways
Reaction Energy Profile
A graph of potential energy versus reaction progress showing barriers and overall energy change.
Multistep Reaction
A reaction that occurs through two or more elementary steps instead of one collision.
Elementary Reaction
A single mechanistic step with its own reactants, products, and activation energy.
Activation Energy
The energy difference between a species and the next transition state peak.
Overall Energy Change
The potential energy difference between products and reactants, often written as ΔE or ΔH.
Transition State / Activated Complex
A highest-energy, unstable arrangement of atoms at the top of an energy barrier.
Reaction Coordinate
The x-axis path showing progress from reactants through intermediates to products.
Potential Energy
The y-axis quantity showing the relative energy of reactants, intermediates, transition states, and products.
Reaction Intermediates
Species formed in one step and consumed in a later step, appearing as valleys between peaks.
Constructing a Multistep Reaction Energy Profile
Plot reactants, add peaks for each step, valleys for intermediates, then label each Ea and total ΔE.
Rate-Determining Step on an Energy Profile
The slowest step, identified by the largest activation energy barrier between adjacent minima and maxima.
Exothermic Reaction Energy Profile
A profile where products are lower in potential energy than reactants.
Endothermic Reaction Energy Profile
A profile where products are higher in potential energy than reactants.
Notes
Reaction Energy Profile
A graph of potential energy versus reaction progress showing barriers and overall energy change.
Multistep Reaction
A reaction that occurs through two or more elementary steps instead of one collision.
Elementary Reaction
A single mechanistic step with its own reactants, products, and activation energy.
Activation Energy
The energy difference between a species and the next transition state peak.
Overall Energy Change
The potential energy difference between products and reactants, often written as ΔE or ΔH.
Transition State / Activated Complex
A highest-energy, unstable arrangement of atoms at the top of an energy barrier.
Reaction Coordinate
The x-axis path showing progress from reactants through intermediates to products.
Potential Energy
The y-axis quantity showing the relative energy of reactants, intermediates, transition states, and products.
Reaction Intermediates
Species formed in one step and consumed in a later step, appearing as valleys between peaks.
Constructing a Multistep Reaction Energy Profile
Plot reactants, add peaks for each step, valleys for intermediates, then label each Ea and total ΔE.
Rate-Determining Step on an Energy Profile
The slowest step, identified by the largest activation energy barrier between adjacent minima and maxima.
Exothermic Reaction Energy Profile
A profile where products are lower in potential energy than reactants.
Endothermic Reaction Energy Profile
A profile where products are higher in potential energy than reactants.
