Topic 6.5 Notes – Energy of Phase Changes
1. What Happens During a Phase Change
A phase change is a physical change between solid, liquid, and gas. The substance stays chemically the same. Only the spacing and attractions between particles change.
The most important idea:
- Temperature remains constant during a phase change.
Temperature measures average kinetic energy.
During melting or boiling, the kinetic energy doesn’t increase. Instead, the added energy changes potential energy by breaking or forming intermolecular forces (IMFs).
Energy Flow and Direction
Endothermic (q > 0)
Energy is absorbed by the system:
- Melting (s → l)
- Vaporization (l → g)
- Sublimation (s → g)
Particles move farther apart. IMFs are broken. System energy increases.
Exothermic (q < 0)
Energy is released by the system:
- Freezing (l → s)
- Condensation (g → l)
- Deposition (g → s)
Particles move closer. IMFs form. System energy decreases.
A common AP trap is saying temperature increases during boiling. It does not. The energy goes into overcoming IMFs, not speeding particles up.
2. Molar Enthalpy of Phase Changes
The energy required per mole for a phase change is the molar enthalpy of phase transition.
- = heat absorbed or released
- = moles
- = molar enthalpy (kJ/mol)
Heat depends directly on the amount in moles. Double the moles → double the heat.
Key Enthalpy Terms
Solid → liquid
Endothermic
Only some IMFs break.
Liquid → gas
Endothermic
Nearly all IMFs break.
Usually much larger than .
Solid → gas
Reverse Processes
Energy relationships are symmetric:
The magnitude is the same. The sign flips.
That equality shows up often in conceptual multiple-choice questions. If vaporization is +40 kJ/mol, condensation must be −40 kJ/mol.
Quick Example
If 0.50 mol of a liquid has :
16 kJ absorbed to vaporize.
Condensing the same amount would release 16 kJ.
3. Heating and Cooling Curves
A heating curve shows temperature vs. heat added. The graph below is for water.

Heating curve for water
Sloped Regions
- Temperature changes.
- Use .
- Kinetic energy changes.
Flat Plateaus
- Phase change.
- Temperature constant.
- Use .
- Potential energy changes (IMFs).
Notice the flat regions at 0°C and 100°C. Those are melting and boiling, where two phases coexist.
The boiling plateau is longer because is larger than .
Cooling curves are the same picture reversed. Signs flip, magnitudes stay the same.
4. Multi-Step Energy Calculations
AP questions often combine warming and phase changes.
Here’s how the thinking flows:
- Identify starting phase and temperature.
- Identify final phase and temperature.
- Break into pieces:
- Temperature change →
- Phase change →
- Convert grams to moles if is in kJ/mol.
- Add all heat values with correct signs.
If a problem gives 25.0 g of a substance that melts at 10°C and boils at 80°C, and you start at 5°C and end at 95°C, you will likely have five segments. Students lose points by skipping one.
Units matter a lot here. If is kJ/mol and you use grams directly, your answer will be wrong even if your setup looks correct.
5. Phase Diagrams and Energy Relationships
A phase diagram shows which phase exists at different temperature and pressure combinations. The example below is for water, with temperature on the x-axis and pressure on the y-axis.
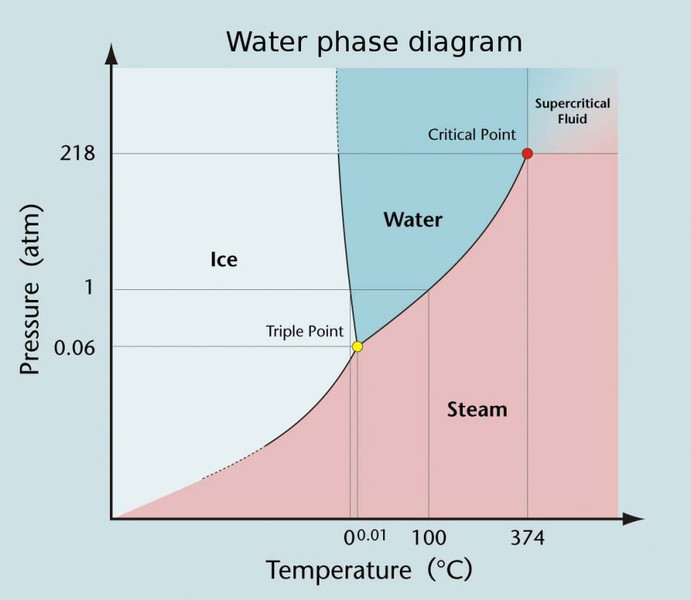
Phase diagram for water
Important features:
Phase boundaries
The lines separating Ice, Water, and Steam. Crossing a line means a phase change.Triple point
The single point where all three phases coexist.Critical point
The high-temperature, high-pressure point where the liquid-gas boundary ends. Above this, a supercritical fluid forms.
Energy connection:
Moving solid → liquid → gas requires increasing energy.
Stronger IMFs lead to:
- Higher melting and boiling points
- Larger and
On the diagram, increasing pressure raises the boiling point because particles need more energy to escape into the gas phase.
Key Takeaways
Heating Curve
A graph of temperature versus heat added showing warming slopes and flat phase-change plateaus.
Cooling Curve
A graph of temperature versus heat removed showing cooling slopes and flat phase-change plateaus.
Phase Changes and Energy Direction
Melting and vaporization absorb heat; freezing and condensation release heat.
Constant Temperature During a Phase Change
A pure substance’s temperature stays unchanged while added or removed energy changes its phase.
Molar Enthalpy of Fusion and Vaporization
The energy per mole required to melt or vaporize a substance at constant temperature.
Complementary Phase-Change Enthalpies
Opposite phase changes have equal magnitudes and opposite signs, such as vaporization and condensation.
Phase-Change Heat Calculation
Use q = nΔH for phase changes, with moles times the molar enthalpy.
Heating and Cooling Curve Calculations
Use q = mcΔT on slopes and q = nΔH or mH on plateaus, then sum steps.
Heat of Vaporization vs Heat of Fusion
Vaporization usually requires more energy than melting because more intermolecular attractions must be overcome.
Molar Enthalpy of Condensation and Freezing
The energy released per mole when a gas condenses or a liquid freezes.
Notes
Heating Curve
A graph of temperature versus heat added showing warming slopes and flat phase-change plateaus.
Cooling Curve
A graph of temperature versus heat removed showing cooling slopes and flat phase-change plateaus.
Phase Changes and Energy Direction
Melting and vaporization absorb heat; freezing and condensation release heat.
Constant Temperature During a Phase Change
A pure substance’s temperature stays unchanged while added or removed energy changes its phase.
Molar Enthalpy of Fusion and Vaporization
The energy per mole required to melt or vaporize a substance at constant temperature.
Complementary Phase-Change Enthalpies
Opposite phase changes have equal magnitudes and opposite signs, such as vaporization and condensation.
Phase-Change Heat Calculation
Use q = nΔH for phase changes, with moles times the molar enthalpy.
Heating and Cooling Curve Calculations
Use q = mcΔT on slopes and q = nΔH or mH on plateaus, then sum steps.
Heat of Vaporization vs Heat of Fusion
Vaporization usually requires more energy than melting because more intermolecular attractions must be overcome.
Molar Enthalpy of Condensation and Freezing
The energy released per mole when a gas condenses or a liquid freezes.
