Topic 3.8 Notes – Representations of Solutions
1. What a Solution Is at the Particle Level
A solution is a homogeneous mixture. That means the solute particles are evenly distributed among solvent particles.
- Solute = substance being dissolved
- Solvent = substance doing the dissolving (often water → aqueous solution)
At the particle level:
- Particles are uniformly dispersed, not clumped at the bottom.
- Attractions between solute and solvent stabilize the mixture.
- The type of attraction depends on whether the solute is ionic or molecular, and whether it’s polar or nonpolar.
A good particulate diagram must show:
- What particles exist (ions? intact molecules?)
- How they’re interacting
If either piece is missing, the diagram is incomplete.
2. Types of Solutes in Aqueous Solutions
Every solute in water falls into one of three categories. Your diagram depends entirely on which type you’re dealing with.
a. Strong Electrolytes (Complete Dissociation)
Examples:
- Soluble salts like ,
- Strong acids like ,
- Strong bases like ,
In water, these fully dissociate into ions.
Example:
Your diagram must show:
- Only separated ions (no intact formula units)
- Correct ratio of ions (1:1 for KBr, 1:2 for something like )
- Water molecules oriented correctly:
- Oxygen (δ-) toward cations
- Hydrogens (δ+) toward anions
The diagram below shows this at both the macroscopic and microscopic level. Focus on the lower particle view, where the sodium and chloride ions are completely separated and surrounded by water molecules oriented by partial charges.
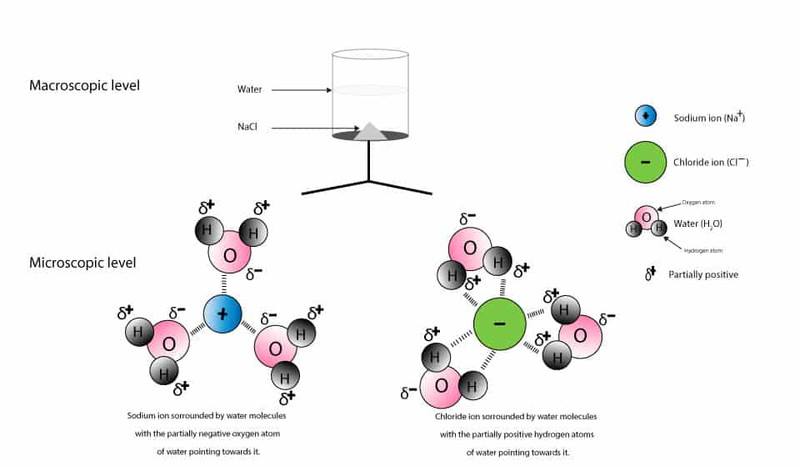
Ion-dipole interactions in a strong electrolyte solution
No ion pairs floating together. That’s a common AP trap.
Because all units dissociate, strong electrolytes conduct electricity well.
b. Weak Electrolytes (Partial Dissociation)
Examples:
- Weak acids like ,
- Weak bases like
These partially ionize.
Your diagram should show:
- Mostly intact molecules
- Some ions present
- Both species coexisting
For example, a weak acid solution would show many molecules and fewer and .
Fewer ions = weaker conductivity. If two solutions have the same molarity but one is weak and one is strong, the strong one has more total ions.
c. Nonelectrolytes (No Dissociation)
Examples:
- Glucose
- Ethanol
These dissolve as intact molecules. No ions form.
Diagram features:
- Only whole molecules
- No charged particles
- If polar → hydrogen bonding with water
- If nonpolar → minimal interaction and possibly low solubility
No ions means no conductivity.
3. Representing Concentration in Diagrams
Concentration is amount of solute per volume of solution. In diagrams, this is shown by number of particles in equal volumes.
a. Dilute vs Concentrated
| Dilute | Concentrated |
|---|---|
| Few solute particles | Many solute particles |
| Large amount of solvent relative to solute | Higher solute-to-solvent ratio |
| Particles spread far apart | Particles closer together |
Volumes must be equal when comparing. If one solution is twice as concentrated, it should show twice as many solute particles in the same space.
b. Ionic vs Molecular Concentration
Count particles after dissociation.
- 0.20 M → produces 3 ions per formula unit
- 0.20 M sugar → 1 particle per formula unit
Same molarity does not mean same total particle count. This shows up when comparing conductivity from diagrams.
c. Saturated Solutions
A saturated solution contains the maximum dissolved solute.
Diagram features:
- Dissolved particles evenly dispersed
- Undissolved solid at the bottom
- Represents dynamic equilibrium between dissolving and recrystallizing
No calculations of molality or percent by mass are required for AP, and colligative properties are outside exam scope for this topic.
4. Showing Solute-Solvent Interactions
Your diagram must communicate the correct intermolecular forces.
Ion-Dipole Interactions
- Between ions and polar water
- Solvation shells form
- Proper orientation of water is essential
Hydrogen Bonding
Occurs when H is bonded to N, O, or F.
In water, this appears as attractions between the partially positive H of one molecule and the partially negative O of another.

Hydrogen bonding between water molecules
The dotted lines represent hydrogen bonds between neighboring molecules.
Distribution of Particles
Correct diagrams show:
- Even dispersion
- Correct ratios
- No clustering (unless precipitate forms)
- No ion pairs for strong electrolytes
If particles are clumped in one region, it’s not a proper solution representation.
5. Constructing or Interpreting a Diagram
When you see a particulate diagram on a quiz:
- Identify the solute type.
- Determine what particles should exist.
- Count particles per volume to compare concentration.
- Check ion ratios.
- Look at solvent orientation.
Teachers love giving two diagrams and asking which conducts better or which is more concentrated. The answer is always hidden in ion count and particle ratios.
Key Takeaways
Particulate Representation of a Solution
A particle-level diagram showing component amounts, distribution, and interactions in a solution.
Solute and Solvent
The dissolved substance and the dissolving medium, respectively.
Representing Concentration in Particulate Diagrams
Show concentration by the number of solute particles per equal volume of solution.
Dilute, Concentrated, and Saturated Solutions
Dilute has few solute particles, concentrated has many, saturated has the maximum dissolved amount.
Equal-Volume Comparison in Solution Diagrams
Concentrations should be compared using the same volume so particle counts are meaningful.
Hydrogen Bonding in Solution Diagrams
An attraction between H bonded to N, O, or F and a lone pair on N, O, or F.
Solvation Shell
A layer of solvent molecules surrounding and stabilizing a dissolved particle.
Electrolyte and Nonelectrolyte
One forms ions in water and conducts electricity; the other forms no ions and does not.
Strong and Weak Electrolytes
One dissociates completely into ions in water; the other dissociates only partially.
Dissociation
The separation of an ionic compound or electrolyte into ions in solution.
Molecular Solute Representation in Water
Show intact molecules, with water oriented toward polar regions if intermolecular attractions exist.
Ion-Dipole Interactions in Water
An ion attracts polar water molecules, with oxygen toward cations and hydrogens toward anions.
Ionic vs Molecular Solute Representation
Ionic solutes separate into ions, while molecular solutes remain intact particles in solution.
Notes
Particulate Representation of a Solution
A particle-level diagram showing component amounts, distribution, and interactions in a solution.
Solute and Solvent
The dissolved substance and the dissolving medium, respectively.
Representing Concentration in Particulate Diagrams
Show concentration by the number of solute particles per equal volume of solution.
Dilute, Concentrated, and Saturated Solutions
Dilute has few solute particles, concentrated has many, saturated has the maximum dissolved amount.
Equal-Volume Comparison in Solution Diagrams
Concentrations should be compared using the same volume so particle counts are meaningful.
Hydrogen Bonding in Solution Diagrams
An attraction between H bonded to N, O, or F and a lone pair on N, O, or F.
Solvation Shell
A layer of solvent molecules surrounding and stabilizing a dissolved particle.
Electrolyte and Nonelectrolyte
One forms ions in water and conducts electricity; the other forms no ions and does not.
Strong and Weak Electrolytes
One dissociates completely into ions in water; the other dissociates only partially.
Dissociation
The separation of an ionic compound or electrolyte into ions in solution.
Molecular Solute Representation in Water
Show intact molecules, with water oriented toward polar regions if intermolecular attractions exist.
Ion-Dipole Interactions in Water
An ion attracts polar water molecules, with oxygen toward cations and hydrogens toward anions.
Ionic vs Molecular Solute Representation
Ionic solutes separate into ions, while molecular solutes remain intact particles in solution.
