Topic 7.8 Notes – Representations of Equilibrium
1. What Equilibrium Looks Like at the Particle Level
At equilibrium, a reaction in a closed system has:
- Equal forward and reverse reaction rates
- Constant amounts of reactants and products
- Both reactant and product particles present at the same time
Constant does not mean equal. It means the numbers stop changing.
Here’s the key idea to picture: particles are still colliding and reacting. Some reactants turn into products, and some products turn back into reactants, but this happens at the same rate. So the total counts stay steady.
The equilibrium constant, K, tells you the ratio of products to reactants at equilibrium.
- Large → mostly products at equilibrium
- Small → mostly reactants
- → comparable amounts
A particulate diagram is just a snapshot of those relative amounts.
2. What Particulate Diagrams Show
Imagine a reaction:
Here is a typical particulate diagram for this system.
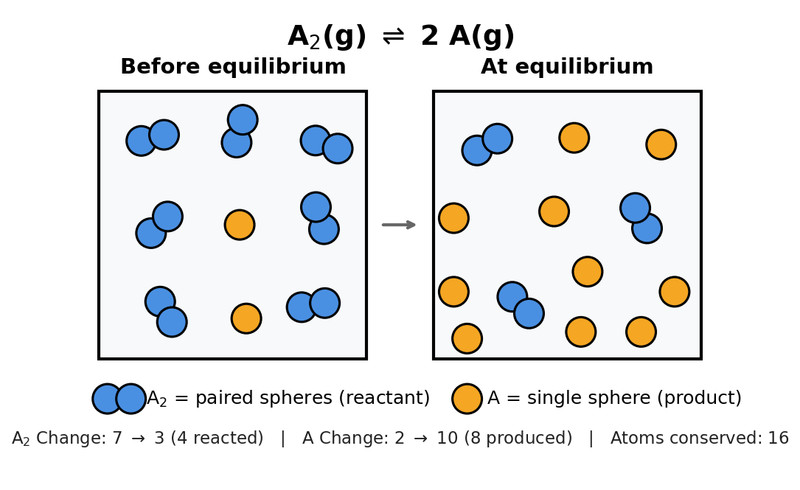
Particulate diagram for before and at equilibrium
On the left, most particles are paired molecules. On the right, at equilibrium, both and single atoms are present. That mixture is the key idea. Equilibrium does not mean all reactants are gone. It means the amounts have stopped changing.
Let’s break down what you should look for.
a. Relative Numbers of Particles
Count products and reactants.
- More product particles than reactant particles → larger
- More reactants than products → smaller
- Similar amounts → near 1
You’re comparing proportions, not total particles. One container might just have more overall particles because it started with more.
When they give you multiple containers at the same temperature and ask you to rank , the one with the highest fraction of products has the largest .
Temperature must be the same. only changes with temperature.
b. Consistency with the Balanced Equation
The diagram must follow stoichiometric coefficients.
For :
- If 1 disappears, 2 must appear.
- You can’t form 1 A from 1 A₂. That breaks conservation of atoms.
Always check:
- Atom counts are conserved.
- Changes match coefficients.
If they show a shift and the particle changes don’t match the balanced equation, the diagram is wrong.
c. Closed System Requirement
Equilibrium only happens in a closed container.
That means:
- No particles enter or leave.
- Total number of each type of atom stays constant.
- Particles rearrange, but nothing is created or destroyed.
On FRQs, if you’re drawing a new diagram after a shift, forgetting conservation of mass is one of the fastest ways to lose points.
3. Connecting Particle Ratios to the Equilibrium Constant
For a general reaction:
Particulate diagrams visually represent this ratio.
You’re not usually calculating numerically from a diagram. You’re judging how far the reaction proceeds.
Here’s a quick comparison idea:
| What You See in the Box | What It Means About K |
|---|---|
| Almost all particles are products | Very large K (reaction strongly product-favored) |
| Mostly reactants, few products | Very small K (reactant-favored) |
| Comparable amounts of both | K around 1 |
You’re translating visual ratios into equilibrium language.
4. Identifying a Shift Using Two Diagrams
Sometimes you’ll see “Time 1” and “Time 2.”
Your job is to decide the direction of shift.
Here’s the logic:
- Compare number of product particles.
- If products increased → shift right.
- If products decreased → shift left.
- Confirm reactants changed in the opposite direction.
- Make sure changes match coefficients.
If the reaction is and product A increases by 4 particles, that corresponds to 2 A₂ reacting. The numbers must line up.
When you explain your answer, refer directly to particle counts. Vague phrases like “it shifted forward” without evidence usually don’t earn full credit.
5. Drawing a New Particulate Diagram After a Shift
If they say the reaction shifts left, you must show the reverse reaction happening.
Example with , shifting left:
- Identify how many product particles will react.
- Remove 2 A for every 1 A₂ formed.
- Add the correct number of A₂ molecules.
- Check atom conservation.
Common mistakes:
- Creating particles from nothing
- Ignoring coefficients
- Changing total atom counts
When you draw, think in “reaction events.” One event follows the balanced equation exactly.
Key Takeaways
Particulate Model
A diagram that represents matter as discrete atoms, ions, or molecules.
Equilibrium in a Particulate Diagram
Reactant and product particles remain present in constant relative amounts with no net change.
Shift Right vs. Shift Left in Particulate Diagrams
Right shift increases product particles; left shift increases reactant particles between two representations.
Using Stoichiometry in Particulate Changes
Particle numbers change according to reaction coefficients when reactants convert to products or reverse.
Law of Conservation of Mass in Particulate Models
The total number of each type of atom stays constant as particles rearrange.
Equilibrium Constant in Particulate Representations
Larger product-to-reactant particle ratios indicate larger K values at the same temperature.
Notes
Particulate Model
A diagram that represents matter as discrete atoms, ions, or molecules.
Equilibrium in a Particulate Diagram
Reactant and product particles remain present in constant relative amounts with no net change.
Shift Right vs. Shift Left in Particulate Diagrams
Right shift increases product particles; left shift increases reactant particles between two representations.
Using Stoichiometry in Particulate Changes
Particle numbers change according to reaction coefficients when reactants convert to products or reverse.
Law of Conservation of Mass in Particulate Models
The total number of each type of atom stays constant as particles rearrange.
Equilibrium Constant in Particulate Representations
Larger product-to-reactant particle ratios indicate larger K values at the same temperature.
