Topic 5.6 Notes – Reaction Energy Profile
1. What a Reaction Energy Profile Shows
A reaction energy profile is a graph of potential energy (y-axis) vs. reaction coordinate (x-axis).
It’s usually drawn for an elementary reaction, which means:
- It happens in one single step.
- Bonds are broken and formed in the same molecular event.
- The energy diagram represents that one step directly.
Reaction Coordinate (x-axis)
This does not mean time.
It represents the progress of bond rearrangement as reactants turn into products. Think of it as tracking how atoms move and how bonds stretch, break, and reform.
Potential Energy (y-axis)
This includes the energy stored in chemical bonds.
As bonds are stretched or broken, potential energy increases. As stronger bonds form, potential energy decreases.
So the graph is a map of energy changes during the reaction.
2. The Three Key Points on the Diagram
Every elementary reaction energy profile has three critical regions.
Reactants
- Located on the left side
- Have a defined potential energy
- Bonds are intact as written in the balanced equation
This is your starting energy level.
Transition State (Activated Complex)
- The highest point on the graph
- Extremely unstable and short-lived
- Bonds are partially broken and partially formed
It is not a substance you can isolate. It’s a fleeting arrangement at maximum energy.
Here’s what a typical energy profile looks like. Focus on the single peak, which represents the transition state.
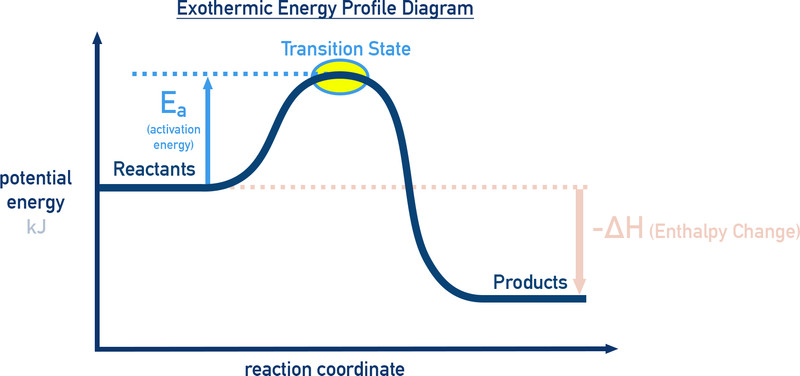
Exothermic reaction energy profile diagram
Products
- Located on the right side
- Have their own potential energy
- Bonds are fully formed in their new arrangement
In this example, the products sit lower than the reactants, indicating an exothermic reaction. Comparing product energy to reactant energy tells you the overall energy change.
3. Activation Energy and Overall Energy Change
Two vertical energy differences matter.
Activation Energy (Ea)
- Measured from reactants up to the peak
- Represents the minimum energy needed to reach the transition state
This is the energy barrier.
Key connection to rate:
- Higher → fewer collisions can overcome it → slower reaction
- Lower → more successful collisions → faster reaction
Students often confuse this with ΔH. They measure different things.
Overall Energy Change (ΔH)
This compares start and finish.
Exothermic
- Products lower than reactants
- Energy released to surroundings
Endothermic
- Products higher than reactants
- Energy absorbed from surroundings
| Exothermic | Endothermic | |
|---|---|---|
| Product energy | Lower than reactants | Higher than reactants |
| Sign of ΔH | Negative | Positive |
| Energy flow | Released | Absorbed |
Notice that a reaction can be highly exothermic and still slow if its activation energy is large. Rate and thermodynamics are separate ideas.
4. Why Activation Energy Controls Reaction Rate
Collision theory explains this clearly.
For a reaction to occur:
- Particles must collide.
- They must collide with correct orientation.
- They must have energy ≥ .
Only collisions with enough kinetic energy can reach the transition state.
Temperature and Rate
When temperature increases:
- Average kinetic energy increases.
- A larger fraction of molecules have energy ≥ .
- More collisions form the transition state.
- Reaction rate increases.
The Arrhenius equation connects the rate constant , activation energy , and temperature . You will not calculate with it on the AP exam, but conceptually:
- Larger → reaction is more sensitive to temperature changes.
- Smaller → temperature has a smaller effect.
AP questions often show two energy diagrams and ask which reaction speeds up more when heated. The one with the larger activation energy changes more dramatically.
5. What You Should Be Able to Do
Given an energy profile, you should confidently:
- Label reactants, products, and transition state
- Identify for the forward reaction
- Determine if the reaction is endothermic or exothermic
- Compare two diagrams and decide:
- Which is faster (lower )
- Which has larger magnitude of
- Explain temperature effects using the idea of collisions reaching the transition state
When you look at the graph, always think:
- Height of peak above reactants → rate.
- Products relative to reactants → ΔH.
- Temperature changes how many particles can climb the peak.
Key Takeaways
Elementary Reaction
A reaction that occurs in a single step through one molecular event.
Reaction Coordinate
The x-axis showing reaction progress as atoms rearrange from reactants to products.
Reaction Energy Profile / Potential Energy Diagram
A graph of potential energy versus reaction progress from reactants through a peak to products.
Reactants, Transition State, and Products on an Energy Profile
Left side starting substances, peak unstable arrangement, and right side final substances.
Activation Energy
The energy difference between the reactants and the transition state.
Overall Energy Change
The energy difference between products and reactants, indicating absorbed or released energy.
Endothermic vs. Exothermic Energy Profiles
Endothermic: products higher than reactants; exothermic: products lower than reactants.
Bond Breaking and Bond Forming in Elementary Reactions
Some bonds must be broken and new bonds formed during a single-step molecular event.
Temperature and Effective Collisions
Higher temperature increases the fraction of collisions energetic enough to reach the peak.
Arrhenius Equation
An equation relating a reaction's rate constant to temperature and activation energy.
Transition State and Activation Energy Barrier
The highest-energy arrangement reactants must reach before forming products in an elementary reaction.
Notes
Elementary Reaction
A reaction that occurs in a single step through one molecular event.
Reaction Coordinate
The x-axis showing reaction progress as atoms rearrange from reactants to products.
Reaction Energy Profile / Potential Energy Diagram
A graph of potential energy versus reaction progress from reactants through a peak to products.
Reactants, Transition State, and Products on an Energy Profile
Left side starting substances, peak unstable arrangement, and right side final substances.
Activation Energy
The energy difference between the reactants and the transition state.
Overall Energy Change
The energy difference between products and reactants, indicating absorbed or released energy.
Endothermic vs. Exothermic Energy Profiles
Endothermic: products higher than reactants; exothermic: products lower than reactants.
Bond Breaking and Bond Forming in Elementary Reactions
Some bonds must be broken and new bonds formed during a single-step molecular event.
Temperature and Effective Collisions
Higher temperature increases the fraction of collisions energetic enough to reach the peak.
Arrhenius Equation
An equation relating a reaction's rate constant to temperature and activation energy.
Transition State and Activation Energy Barrier
The highest-energy arrangement reactants must reach before forming products in an elementary reaction.
