Topic 1.3 Notes – Estimating Limit Values from Graphs
What a limit means on a graph
When we write
it means as gets closer to , the y-values get closer to .
Two reminders that matter a lot on quizzes:
- The limit is about approach, not the actual value at .
- can be different from the limit, or not exist at all.
One-sided limits
Sometimes you only look from one direction:
- : approach from the left (values less than )
- : approach from the right (values greater than )
The full limit exists only if both sides agree:
If the left and right limits are different, the limit does not exist (DNE).
On the AP exam, when they ask for a limit from a graph, they expect you to clearly indicate if it’s a one-sided limit or if the two sides don’t match.
Estimating limits from a graph
When you’re given only a graph, you’re reading behavior visually.
Here’s a typical example:
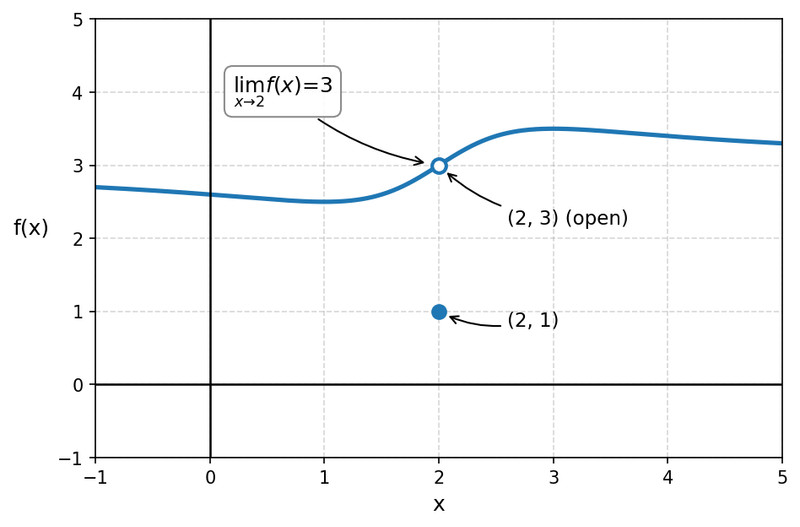
Suppose you’re asked for .
- From the left, the graph heads toward .
- From the right, it also heads toward .
- So the limit is 3.
Even though the graph shows a filled dot at , meaning , the limit is still 3.
That distinction shows up constantly in multiple-choice questions. They love testing whether you confuse the hole with the actual function value.
What to ignore
- Ignore whether the point is filled or open when finding the limit.
- Ignore the value of .
- Focus only on what the graph is doing as it approaches.
When a limit does not exist
There are three main ways limits fail to exist in this unit.
1. Left and right don’t match (jump)
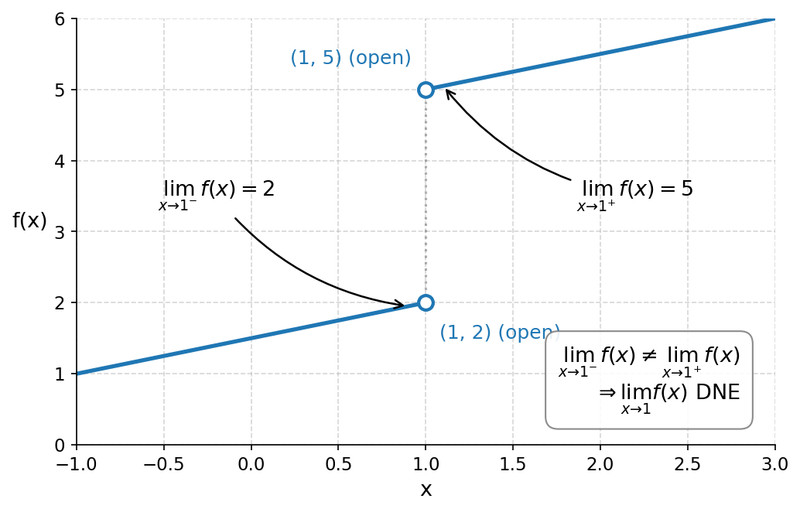
Jump discontinuity at x = 1
In this graph, the function approaches different values from the left and right at .
Since 2 ≠ 5,
This is called a jump discontinuity, and it’s the most common DNE scenario on tests.
2. Unbounded behavior (vertical asymptote)
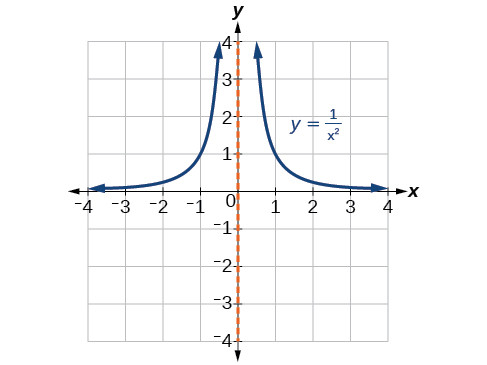
Vertical asymptote for
As the graph shows, both sides rise without bound as .
We write:
That means the function is unbounded. The limit does not exist as a finite number.
On free-response, if they ask whether the limit exists, you would say it does not exist because the function increases without bound.
3. Oscillation
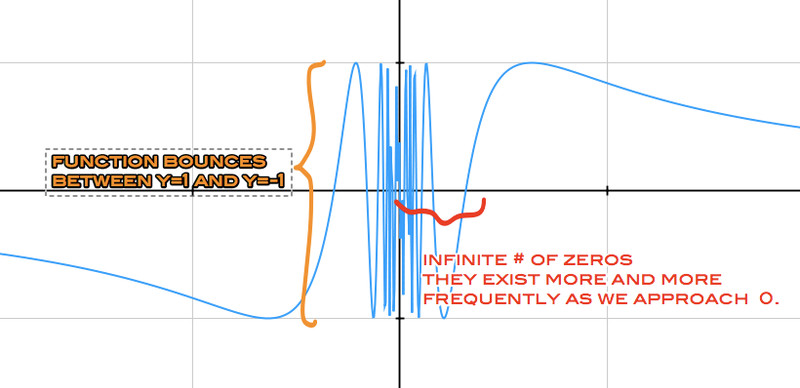
Oscillation of near 0
Near , the graph keeps bouncing between -1 and 1 more and more rapidly.
It never settles near a single value, so
Anytime the graph keeps oscillating and doesn’t calm down near one number, the limit doesn’t exist.
Issues of scale
Graphs can lie to you.
Because of window size or zoom level:
- A vertical asymptote might look like the graph is leveling off.
- Rapid oscillation might look like a solid blur.
- A tiny jump may look continuous.
On the AP exam, they expect you to recognize that graphical representations can miss behavior. If something looks suspicious, check both sides carefully. Never assume smoothness just because the curve looks smooth.
