Topic 6.1 Notes – Exploring Accumulations of Change
1. Accumulation of Change from a Rate Function
You already know that a derivative gives a rate of change. If is velocity, then would be acceleration.
Integration goes the other direction. It adds up a rate over an interval to recover total change.
If a function represents a rate of change, then
represents the net accumulation from to .
Think in context:
- If is velocity → = change in position
- If is a water flow rate → integral = total volume added
- If is population growth rate → integral = total population change
The key mental switch:
Area under a rate curve = total change in the original quantity.
The shaded region under the curve between and represents , the change in position.
The shaded region is not just “area.” It represents something real, like miles traveled or gallons collected.
2. Signed Area and What It Means
A definite integral gives signed area, not just geometric area.
- If the graph is above the x-axis → accumulation is positive.
- If the graph is below the x-axis → accumulation is negative.
That sign matters in context.
If velocity is negative, the object is moving backward. The integral reflects that by subtracting from the total change.
In the graph below, notice how the shaded region above the axis counts positively and the shaded region below the axis counts negatively.
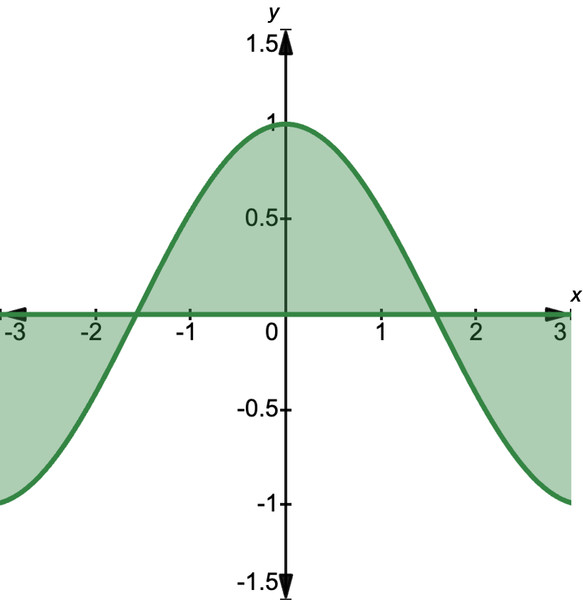
Positive and negative signed area
Two phrases that show up on tests:
- Net change → use signed area.
- Total accumulated amount (or total distance) → add absolute values of each region.
If a particle moves forward 5 units and backward 3 units:
- Net change = 2
- Total distance = 8
AP questions love that distinction.
If the graph crosses the axis, split the integral at the crossing point. Do not lump it together as one big shape.
3. Finding Accumulation from a Graph
Often you won’t compute an integral with antiderivatives. You’ll be given a graph of a rate function and asked to interpret area.
A. Using Geometry
If the graph forms basic shapes, use geometry.
- Rectangle →
- Triangle →
- Trapezoid →
Example idea: Suppose a rate graph is a triangle above the axis from to with height 6. Accumulation = .
If part of that triangle were below the axis, the area would count as negative.
This type of question appears frequently in:
- No-calculator multiple choice
- Early parts of FRQs where you interpret a given graph
B. Breaking Into Intervals
When:
- The shape changes
- The graph crosses the axis
- The slope changes
Break the interval into pieces and compute each region separately.
Add them carefully, keeping signs straight. Most mistakes happen right here.
4. Units of Accumulation
The unit of a definite integral is:
Examples:
- meters/second × seconds = meters
- liters/hour × hours = liters
- bacteria/day × days = bacteria
On FRQs, you must state units. If the rate is in gallons per minute and time is in minutes, your final answer must be in gallons. Missing units costs points.
A quick check mid-problem: Do the units multiply correctly? If not, something is off.
5. How to Think Through These on a Test
When you see a rate graph:
- Ask yourself what the rate measures.
- Identify the interval.
- Decide whether the question wants net change or total amount.
- Compute area (geometry or interpret the integral).
- Attach units and interpret in context.
Common traps:
- Forgetting negative area.
- Giving geometric area when the question asks for net change.
- Treating the graph as the original function instead of a rate.
- Dropping units in the final sentence.
When you see a rate graph on the AP exam, your brain should automatically say: Area = accumulation.
