Topic 1.4 Notes – Estimating Limit Values from Tables
What a Limit Is
When you see
it means:
As x gets closer and closer to , the function values get closer and closer to .
Three things to keep straight:
- The function does not need to be defined at .
- might equal the limit, might be different, or might not exist.
- A limit is about near, not at.
If you plug in directly and get a normal real number, that’s usually the limit (assuming the function is continuous there). If you plug in and get something undefined like , that doesn’t mean the limit doesn’t exist. It means you need another approach. That’s where tables come in.
One-Sided Limits
Sometimes behavior from each side matters.
- means approach from the left (values less than ).
- means approach from the right (values greater than ).
The full limit exists only if both sides match:
If the two sides approach different numbers, the limit does not exist (DNE).
Here’s what that looks like visually at :
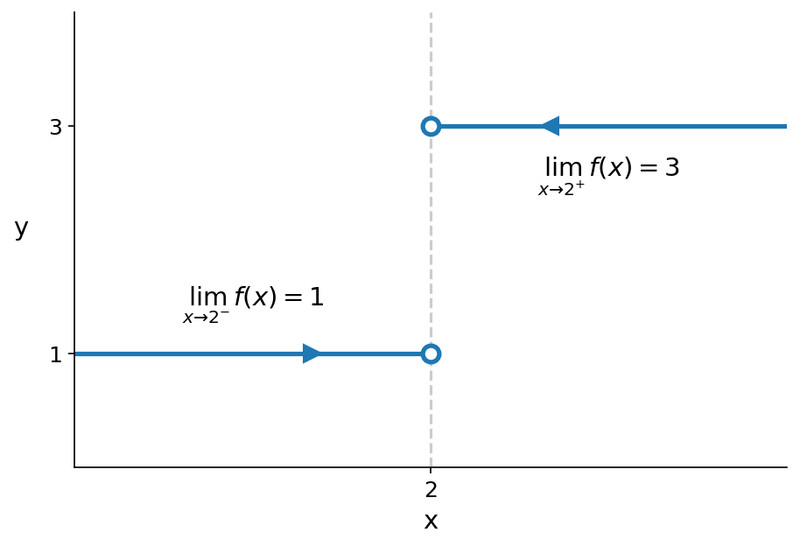
Jump discontinuity at
Even if both sides are perfectly well-behaved, if they approach different heights, there is no two-sided limit.
Estimating a Limit from a Table
When you’re given a table, you’re using numerical evidence to decide what value the function is approaching.
Step-by-step process
Check values on both sides of
Look at x-values slightly less than and slightly greater than the target.Example pattern:
- Left: 1.9, 1.99, 1.999
- Right: 2.1, 2.01, 2.001
Look at the corresponding values
Ignore if it’s listed. That’s not what we’re studying.Watch the trend
Ask:- Are both sides settling toward the same number?
- Are they separating?
- Are they getting very large positive or negative?
The limit is the number both sides are squeezing toward.
Here’s what a “good” table looks like when a limit exists as :
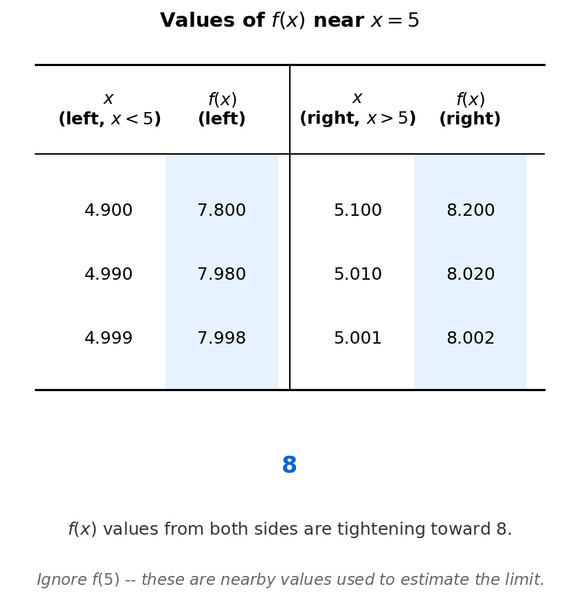
Table of values approaching 5 from both sides
Both sides tighten around 8. So
Possible Table Behaviors
You only need to recognize a few patterns.
1. Both sides approach the same finite number
✔️ The limit exists and equals that number.
Even if the function never actually equals it.
2. Left and right approach different numbers
❌ The limit does not exist. This often signals a jump discontinuity.
3. Values grow without bound
If numbers explode upward,
If they drop without bound,
That’s vertical asymptote behavior. On AP problems, you may state the limit is or .
4. Oscillating or unstable values
If the outputs bounce around and don’t settle toward anything, the limit does not exist.
When Tables Are Used
Tables show up when:
- You only have numerical data.
- Direct substitution gives .
- A function is undefined at the point.
- A problem asks you to justify a limit using numerical evidence.
On multiple choice, you’ll scan quickly for trends. On free response, you may need to say something like:
“As x approaches 3 from both sides, the values of approach 4. Therefore, the limit is 4.”
That justification matters. You’re connecting data to the definition of a limit.
