Topic 5.9 Notes – Connecting a Function, Its First Derivative, and Its Second Derivative
How f, f′, and f″ Are Connected
Think of this as three layers of information:
- → the function itself (position)
- → slope of
- → how the slope is changing
Here are the core relationships:
- If , then is increasing
- If , then is decreasing
- If , then is concave up and is increasing
- If , then is concave down and is decreasing
Everything in this topic is applying these facts, either from equations or from graphs.
What Each Derivative Tells You About the Graph
Increasing and Decreasing
You already know this algebraically. Now read it graphically.
If you’re looking at a graph of :
- Above the x-axis → → increasing
- Below the x-axis → → decreasing
- Where → critical points of
If crosses the x-axis:
- Negative → Positive → has a relative minimum
- Positive → Negative → has a relative maximum
That’s the First Derivative Test, just visually.
Concavity
Concavity comes from how the slope behaves.
- → concave up → slopes increasing
- → concave down → slopes decreasing
If you’re given the graph of :
- If is rising → is concave up
- If is falling → is concave down
- Relative extrema of → possible inflection points of
An inflection point requires a sign change in , not just .
The Big Structural Connections
These two facts tie everything together:
- All relative extrema of occur at x-intercepts of (where sign changes).
- All inflection points of occur at relative extrema of .
Why?
- A max or min means the slope changes sign → crosses zero.
- An inflection point means concavity changes → slope switches from increasing to decreasing → has a relative max or min.
That second connection is the one students forget under pressure.
Seeing It All Together
Here’s a clean visual of a function and its first two derivatives. Take a minute and trace one x-value straight down through all three graphs.
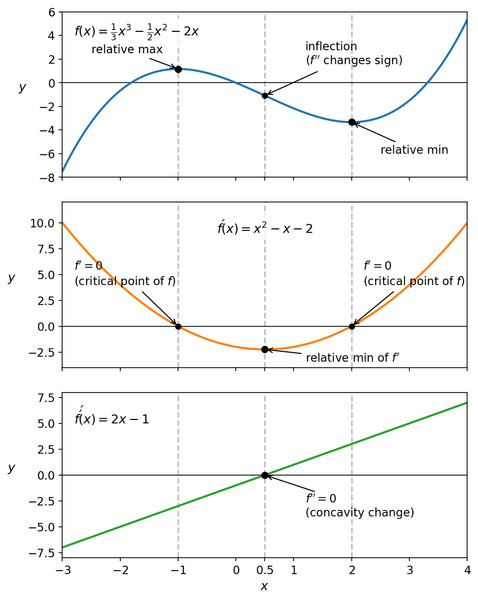
A function and its first and second derivatives, aligned vertically
Read this picture carefully:
- Where crosses the x-axis (−1 and 2) → extrema of .
- Where has a minimum (0.5) → inflection point of .
- Where crosses the x-axis (0.5) → concavity changes in .
Everything lines up vertically, which is exactly how you should think about these relationships.
On the AP exam, they love stacking graphs like this and asking you to justify conclusions using derivative language.
If You’re Given f″ Instead
From a graph of , you can determine:
- Sign of → concavity of
- Where changes sign → inflection points of
If you’re also told :
- If → relative minimum
- If → relative maximum
That’s the Second Derivative Test in action.
Be precise when justifying. A complete justification sounds like:
“Since , is concave up at , and because , has a relative minimum at .”
The graders look for that logical chain.
Common Traps
- Saying “” means max or min. You must check sign change.
- Saying “” means inflection. You must check sign change.
- Mixing up:
- means increasing
- means concave up
- Forgetting that extrema of correspond to inflection points of .
