Topic 8.1 Notes – Finding the Average Value of a Function on an Interval
1. What the Average Value of a Function Is
If is continuous on , its average value on that interval is
Break that formula apart:
- → total accumulated change (signed area).
- → length of the interval.
- So you’re doing
(total accumulation) ÷ (interval length).
This mirrors the discrete average:
Integration replaces the “sum of values” with an infinite sum over the interval.
Geometric meaning
Now think visually. The definite integral gives the area under the curve on . The average value is the height of a horizontal line so that a rectangle with base has the same area as that region.
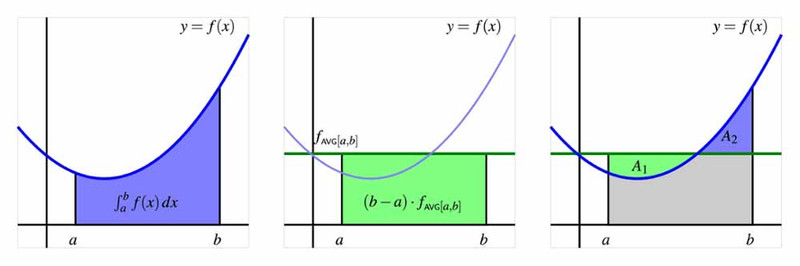
Geometric interpretation of average value on
In the middle panel, the rectangle’s height is the average value. In the right panel, the horizontal line balances the areas above and below it so the total signed area matches the integral.
So the average value is literally a “balance height” for the function on that interval.
2. How to Find the Average Value
When you’re asked to find it, the process is mechanical.
Write the formula
Evaluate the definite integral
- Find an antiderivative .
- Compute .
Divide by .
Quick example
Find the average value of on .
Antiderivative:
Evaluate:
Divide:
Average value = 2.
That’s a typical no-calculator FRQ part. Clean setup and algebra matter.
If You’re Given a Graph
You may not have a formula. Then:
- Compute signed area.
- Above x-axis → positive
- Below x-axis → negative
- Add all pieces.
- Divide by .
If a region dips below the axis, that lowers the average. Students often forget the sign and accidentally compute total area instead.
If the Function Is Defined by an Integral
Suppose
To find the average value of on , you must compute:
You are averaging , not . That means another integral. On FRQs, this is where FTC Part 1 or Part 2 shows up. Slow down and track which function is being averaged.
3. Why This Shows Up on Tests
You’ll see three main versions.
Straight computation
Very common as an early FRQ part. They want:
- Correct setup
- Proper antiderivative
- Final simplified number
Missing the costs easy points.
Conceptual reasoning
Questions like:
- Is the average value positive or negative?
- Is it greater than 1?
- Between which two values does it lie?
If most of the graph lies above the x-axis, expect a positive average. Large negative regions pull it down.
Connection to the Mean Value Theorem for Integrals
If is continuous on , then there exists some such that
So the function actually hits its average value somewhere.

Average value and the Mean Value Theorem for Integrals
In the middle panel, the rectangle with width has the same area as the shaded region under . That rectangle’s height is the average value. In the right panel, the horizontal line at that height intersects the curve, showing the point where equals the average.
You usually don’t solve for , but you should understand what it represents.
4. Average Value vs. Average Rate of Change
Students mix these up constantly.
| Average Value | Average Rate of Change |
|---|---|
| Uses an integral (area). | Uses only endpoint values. |
| Gives a typical y-value. | Gives slope of the secant line. |
One measures height. The other measures slope.
