Topic 2.3 Notes – Estimating Derivatives of a Function at a Point
1. What the Derivative at a Point Is
The derivative at a point, written , tells you how fast is changing at exactly .
Two equivalent ways to think about it:
- Instantaneous rate of change at
- Slope of the tangent line to the graph at
Formally, it’s defined as a limit:
That fraction is the average rate of change from to . As shrinks toward 0, that average rate becomes the instantaneous rate.
For comparison, the average rate of change on is:
The derivative is what happens when that interval collapses to a single point.
Units Matter
If:
- is in seconds
- is in meters
Then:
On FRQs, you must interpret this in context. If the derivative is 3, that means “the function is increasing at 3 output-units per input-unit” at that moment.
2. Estimating a Derivative from a Table
When you’re given a table of values, you don’t have a formula. So you approximate using slopes between nearby points.
Best Estimate Strategy
Use values closest to .
Even better, use points on both sides of if possible. This is called a symmetric difference quotient:
Why this is better: it balances the estimate from both directions.
If you only have one side available, use:
What Good Work Looks Like on a Free Response
Suppose you’re estimating and the closest values are at 3.8 and 4.2.
You would write:
Then:
- Substitute numbers clearly
- Compute
- Include units
- Interpret in words
A complete interpretation sounds like:
When , the function is increasing at approximately 5 liters per minute.
The AP graders want the math + substitution + units + meaning.
Common Mistakes
- Using values far away from
- Forgetting to divide by the change in
- Ignoring units in the interpretation
3. Estimating a Derivative from a Graph
Now you’re given a graph instead of numbers.
The derivative at a point is the slope of the tangent line there.
Here’s what that looks like visually. The red line is tangent to the blue curve at , and its slope represents .
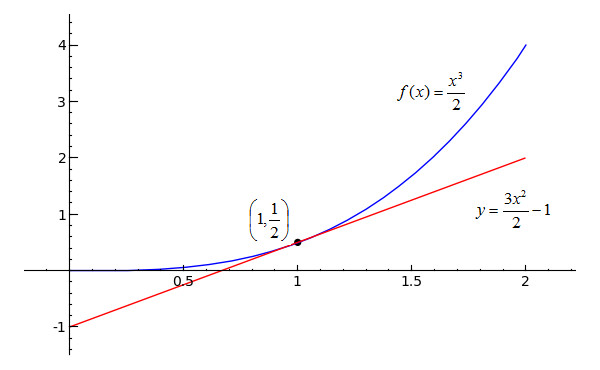
Tangent line showing as slope
How You Estimate
- Find the point .
- Picture or lightly sketch the tangent line.
- Choose two clear points along that tangent line.
- Compute slope = rise/run.
Important observations:
- Increasing graph →
- Decreasing graph →
- Flat spot →
- Steeper means larger magnitude
Big trap: students often pick two points on the curve, not the tangent line. That gives an average rate of change, not the instantaneous rate.
Also check the axes. If the graph counts by 2s or 0.5s, your slope changes.
4. Using Technology to Estimate a Derivative
On calculator-allowed parts, you can compute a numerical derivative at a point.
Behind the scenes, your calculator is approximating:
using a very small .
You might:
- Use the “nDeriv” feature on a TI calculator
- Type into Desmos
Things to Double-Check
- Radian mode for trig functions
- Correct evaluation point
- Sign makes sense from the graph
If the graph is decreasing at that point and your calculator says the derivative is positive, something is wrong.
5. Common Exam Mistakes
- Confusing average rate with instantaneous rate
- Forgetting that decreasing means negative derivative
- Not centering the estimate when possible
- Dropping units in interpretation
- Reporting too many decimals without context
On multiple choice, they love answers that match common errors like forgetting to divide by the change in . Always pause and sanity-check.
