Topic 1.9 Notes – Connecting Multiple Representations of Limits
What It Means for a Limit to Exist
When we say we mean:
- As ,
- As ,
Both sides must agree.
The actual function value can:
- Equal
- Be different from
- Not exist
The limit can still exist in all three cases.
Two reminders that matter a lot on tests:
- If left-hand limit ≠ right-hand limit → the limit does not exist.
- Limits describe approach behavior, not plugging in (unless the function is continuous there).
Everything in this topic is recognizing that idea in different forms.
Numerical Representation
A table gives you values of close to and corresponding .
What you’re scanning for:
- Do values from the left and right both approach the same number?
- Do outputs level off toward something?
- Do they grow very large (→ )?
Example table near :
| 1.9 | 1.99 | 2.01 | 2.1 | |
|---|---|---|---|---|
| 4.1 | 4.01 | 3.99 | 3.9 |
Both sides are approaching 4, so
Even if the table also listed , the limit would still be 4.
Common mistakes:
- Ignoring one side.
- Assuming the listed value at is the limit.
- Deciding too fast when the trend isn’t clear yet.
Tables give evidence, not proof. They approximate behavior.
Graphical Representation
A graph shows the shape of the function near . You’re watching where the curve heads as it approaches the vertical line .
Here’s a classic removable discontinuity. The function simplifies to everywhere except at , which creates a hole:
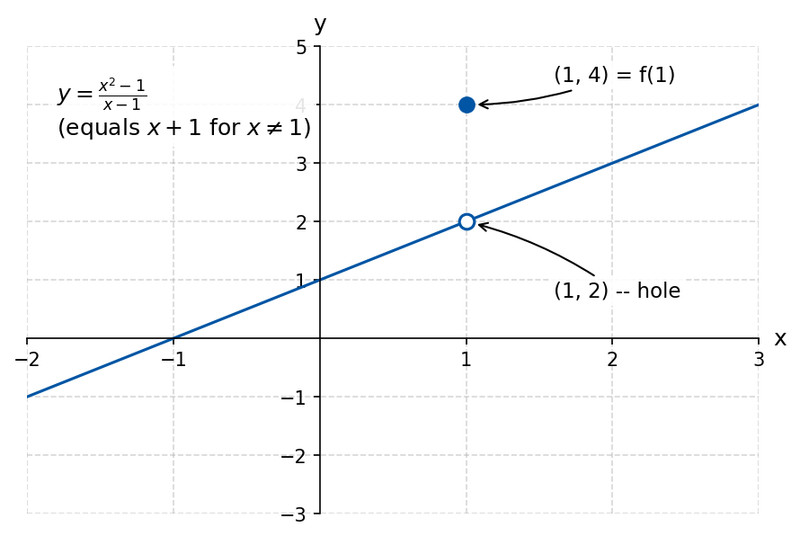
Removable discontinuity at
What this shows:
- As , the graph approaches 2 from both sides.
- There’s a hole at (1,2).
- There’s a filled dot at (1,4), so .
So: even though .
Things to recognize quickly on a graph:
- Open circle → limit may exist.
- Jump (left and right approach different heights) → limit does not exist.
- Vertical asymptote → infinite limit.
On multiple choice, they love graphs where the filled dot distracts you. Always read the value being approached, not the value at the point.
Algebraic Representation
Here you calculate the exact value.
If direct substitution works, use it.
If substitution gives , simplify first.
Example:
Factor:
Cancel (valid because we care about behavior near 3):
Now substitute:
The original function might be undefined at 3, but the limit is 6.
Algebra gives you precision. Graphs and tables confirm behavior visually or numerically.
Connecting the Representations
This is where AP questions live.
You might be told: - “A function has . Which representation could match?”
Your job:
- Determine the limit behavior in each answer choice.
- Check left-hand and right-hand behavior.
- Ignore unless asked.
- Eliminate anything with mismatched one-sided limits.
Treat each answer independently. Don’t compare choices to each other. Compare each one to the required limit behavior.
Patterns you should instantly recognize:
- Removable discontinuity
Table approaches a number. Graph shows a hole. Algebra simplifies cleanly. Limit exists. - Jump discontinuity
Left and right approach different numbers. Limit does not exist. - Infinite limit
Table values explode. Graph has vertical asymptote. Algebra shows denominator → 0 while numerator ≠ 0.
Sometimes one representation makes the answer obvious while another looks messy. Use whichever reveals the behavior most clearly.
