Topic 6.5 Notes – Interpreting the Behavior of Accumulation Functions Involving Area
1. What an Accumulation Function Is
An accumulation function is defined by
This means:
- is the net signed area under from to .
- Area above the x-axis counts positive.
- Area below the x-axis counts negative.
By the Fundamental Theorem of Calculus:
That connection drives everything in this unit.
If you remember nothing else, remember this:
The graph of is the graph of .
So:
- If , then → g is increasing
- If , then → g is decreasing
- If , then → possible critical point of g
Since :
- If is increasing → is concave up
- If is decreasing → is concave down
You are always analyzing to understand .
2. Analyzing from Information About
Most problems give you a graph, table, equation, or context for and ask about .
A. Increasing and Decreasing
Because :
- increases where is above the x-axis.
- decreases where is below the x-axis.
For local extrema of :
- Local max when changes from positive to negative.
- Local min when changes from negative to positive.
Zeros alone are not enough. You must check the sign change.
B. Concavity and Inflection Points
Because :
- is concave up where is increasing.
- is concave down where is decreasing.
Inflection points of happen where changes from increasing to decreasing or vice versa.
Students often mix this up and look at where . That tells you about extrema of , not concavity.
C. Finding Values of
To find , interpret it as signed area.
If you’re given a graph, break it into geometric shapes and compute each piece.
In the graph above, you can see a triangle above the axis, a rectangle below the axis, and a semicircle above the axis. Each contributes positive or negative area to .
For example:
- Triangle area
- Rectangle area
- Semicircle area
Add areas above the axis. Subtract areas below.
Be careful with:
- Reversing bounds (which flips the sign)
- Forgetting that below-axis area is negative
On FRQs, you must show the geometric work to earn full credit.
3. Working Across Representations
The AP rotates formats constantly. Same idea, different surface.
A. Graph of
Most common situation.
In the diagram, you’re given the graph of with shaded regions representing signed area.
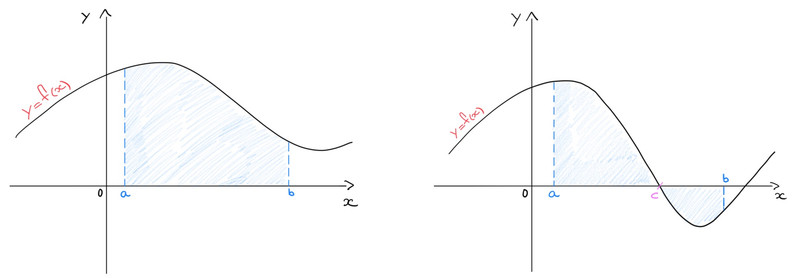
Graph of with signed area regions
When you see this:
- Treat it as .
- Sign of graph → increasing/decreasing of .
- Slope of graph → concavity of .
- Area → values of .
Big trap: students describe the graph as if it were . It’s not.
B. Table of Values
If given values of :
- Positive entries → increasing there.
- Negative entries → decreasing.
- Changes in help you estimate concavity of .
- Approximate using Riemann sums if asked.
You cannot magically know exact values unless integration is possible.
C. Equation for
If is given explicitly:
- Solve for increasing.
- Compute for concavity.
- Evaluate definite integrals directly for .
On no-calculator sections, expect manageable algebra.
D. Verbal Context
If is a rate (gallons/hour, people/minute, meters/second):
- is the total accumulated amount.
- Units of = (units of ) × (units of ).
Example: velocity in meters/second → accumulation gives total displacement in meters.
4. Absolute Extrema of an Accumulation Function
On a closed interval:
- Find critical points where .
- Evaluate at:
- Endpoints
- Those critical points
- Compare values.
Do not assume the highest point of gives the max of . Accumulation depends on total area, not height.
5. Common Mistakes
- Mixing up , , , and .
- Forgetting endpoints for absolute extrema.
- Calling every zero of a max or min of .
- Using sign of to determine concavity of .
- Dropping a negative when area is below the axis.
