Topic 8.3 Notes – Using Accumulation Functions and Definite Integrals in Applied Contexts
Accumulation and Net Change
Suppose is the rate of change of some quantity . Then
This is the Net Change Theorem. It’s just the Fundamental Theorem of Calculus applied in context.
- The derivative tells you how fast changes.
- The definite integral adds up all those tiny changes.
- The result is the total change from to .
So whenever you see “rate,” your brain should think integral = accumulated change.
Accumulation Functions
An accumulation function is defined like this:
What this means:
- measures how much has accumulated from to .
- (FTC Part 1)
If represents a rate, then represents the total change in the original quantity since time .
Quick reminder connection:
- FTC Part 1:
- FTC Part 2:
What the Sign Means
- If , the quantity increases.
- If , the quantity decreases.
- The definite integral gives net change (positive area minus negative area).
That “net” part matters a lot.
Interpreting Definite Integrals in Context
When you see
translate it in words:
“The net change in the quantity from time to time .”
Some common examples:
- Velocity → Displacement
gives net change in position. - Population growth rate → Population change
gives change in population. - Flow rate (liters/minute) → Total volume change
Integral gives net fluid added or removed. - Marginal cost → Change in total cost
Integrating marginal cost over production levels gives cost increase.
Net Change vs Total Amount
If a problem asks for total distance traveled, not displacement:
AP loves this distinction. Negative velocity subtracts from displacement but still counts toward total distance.
Solving Accumulation Problems
Here’s the structure most FRQs follow.
Identify the rate function.
Check the units. They should be “something per time.”Set up the definite integral.
Use the interval given in the problem.Evaluate the integral.
- Antiderivative if possible (no-calculator section).
- Numerical approximation if needed (calculator section).
Use the initial value if asked for the actual amount.
If a tank contains 500 liters at , and water flows in at rate , then the amount at time is
Students often forget to add the initial value. That’s an easy point loss.
Graphical Interpretation of Accumulation
If you’re given a graph of a rate function , the integral represents signed area under the curve.
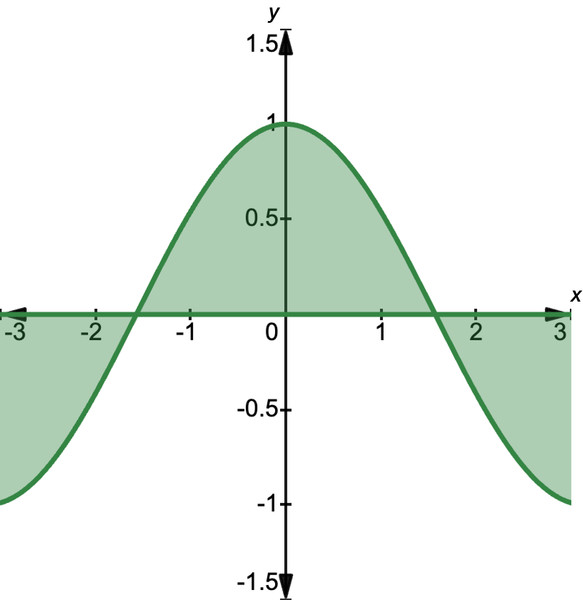
Signed area under a curve
In the graph shown, the shaded region above the x-axis counts as positive area, and the shaded regions below the x-axis count as negative area.
From a graph:
- Area above axis → positive contribution
- Area below axis → negative contribution
- If areas cancel, net change could be small even if total movement was large.
If an accumulation function is defined by
:
- increases when
- decreases when
- Local maxima/minima of occur where and changes sign
That last idea shows up often in multiple choice.
