Topic 5.8 Notes – Sketching Graphs of Functions and Their Derivatives
How derivatives determine the shape of a graph
Everything starts with what the derivatives mean.
First derivative → slope behavior
- → is increasing
- → is decreasing
- or undefined → critical point
Critical points are candidates for local maxima or minima. They are not automatically extrema.
Second derivative → concavity
- → concave up (slopes increasing)
- → concave down (slopes decreasing)
- Sign change in → possible inflection point
Here’s a single graph that ties these ideas together. Notice how the sign of matches increasing or decreasing behavior, and how points where or is undefined show up as critical points.
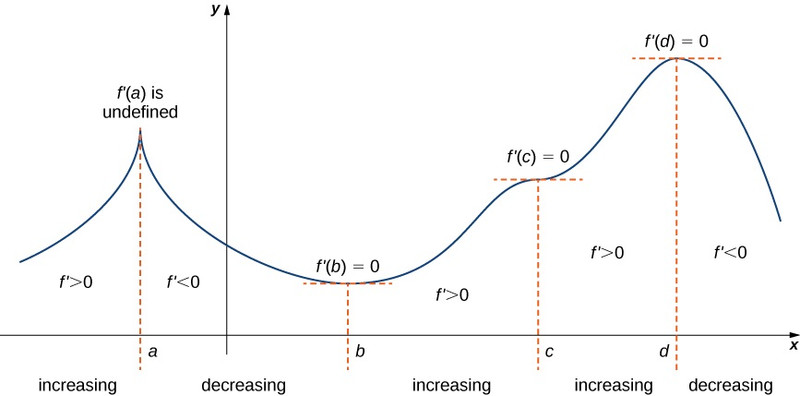
Graph showing critical points and intervals of increase and decrease
If you can look at a graph like this and mentally describe where is positive or negative and where changes sign, you understand this topic.
The full graph sketching process
When you’re given an equation and asked to sketch , build the structure piece by piece.
1. Domain and discontinuities
- Polynomials → domain is all real numbers.
- Rational/log functions → check where undefined.
- Note vertical asymptotes or holes if they exist.
2. Intercepts and symmetry
- x‑intercepts → solve
- y‑intercept → compute
- Even →
- Odd →
These anchor your sketch.
3. Critical points
Solve (or where undefined but in domain).
These split the number line into intervals for sign analysis.
4. Increasing and decreasing intervals
Test values in each interval:
- → increasing
- → decreasing
If the sign changes:
- → local max
- → local min
You must reference the sign change when justifying on FRQs.
5. Concavity and inflection points
Solve for candidates.
Check sign change of .
No sign change means no inflection point. This is a very common mistake.
Moving between , , and
A lot of AP questions give you only a graph of or a table of values of and ask about . You need to translate quickly.
Here’s the relationship summary:
| If you’re given… | You can conclude about f |
|---|---|
| Graph of | Above x-axis → f increasing Below x-axis → f decreasing Sign change → local extremum |
| Graph of | Positive → concave up Negative → concave down Sign change → inflection point |
| Graph of | Horizontal tangent → Steeper slope → larger || Bending upward → |
One key connection students miss:
If has a local max or min, then there.
Extrema of correspond to zeros of .
Using numerical and graphical information
Sometimes you’ll get a table:
| x | 1 | 2 | 3 |
|---|---|---|---|
| -2 | 0 | 4 |
From just this:
- changes from negative to positive at
- So has a local minimum at 2
Even without an equation.
If you’re given a graph of that touches but doesn’t cross the axis, that means:
- No sign change
- No local extremum
The AP loves that subtlety.
Justifying correctly
Strong explanations sound like this:
- “Since for , is increasing on .”
- “Because changes from positive to negative at , has a local maximum at 3.”
- “Since , the graph is concave down.”
Always reference the derivative, the sign, and the interval or point.
