Topic 5.6 Notes – Determining Concavity of Functions over Their Domains
Concavity and the Behavior of the First Derivative
Think about what concavity actually means.
- Concave up: tangent slopes are increasing as increases.
- Concave down: tangent slopes are decreasing as increases.
Since gives slope, concavity depends on how behaves.
- If is increasing → is concave up.
- If is decreasing → is concave down.
That naturally leads to the second derivative.
- tells you whether is increasing or decreasing.
- So the sign of controls concavity.
Here’s the clean relationship you should know cold:
- → concave up
- → concave down
Visually, it looks like this. Focus on how the tangent line changes as you move from left to right.
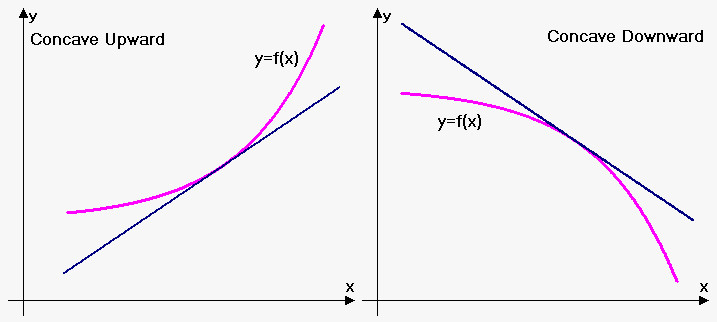
Concave up and concave down with tangent lines
On the left, the tangent slopes are getting steeper as increases, so is increasing and the graph is concave up. On the right, the tangent slopes are getting less positive and then more negative, so is decreasing and the graph is concave down.
Using the Second Derivative to Find Intervals of Concavity
When given a formula, the process is mechanical but important to justify clearly.
- Find .
- Determine where and where .
- Write answers in open interval notation.
Quick example:
Let .
Set :
Now test intervals:
- Pick : → negative → concave down on
- Pick : → positive → concave up on
Write it clearly:
- Concave down on
- Concave up on
On FRQs, you must connect the sign to the conclusion: “Since on , is concave down on that interval.”
Concavity at a Specific Point
If they ask about concavity at :
- Compute .
- Interpret the sign.
- → concave up at
- → concave down at
- → inconclusive
Zero does not automatically mean inflection. That mistake costs points every year.
Points of Inflection
A point of inflection is where the function changes concavity.
Two things must happen:
- or undefined
- changes sign
Both are required.
Using the previous example:
- Sign changed from negative to positive
So the inflection point is
Always give the full ordered pair unless the problem clearly asks for just the x-value.
A sign chart makes the sign change easy to see:
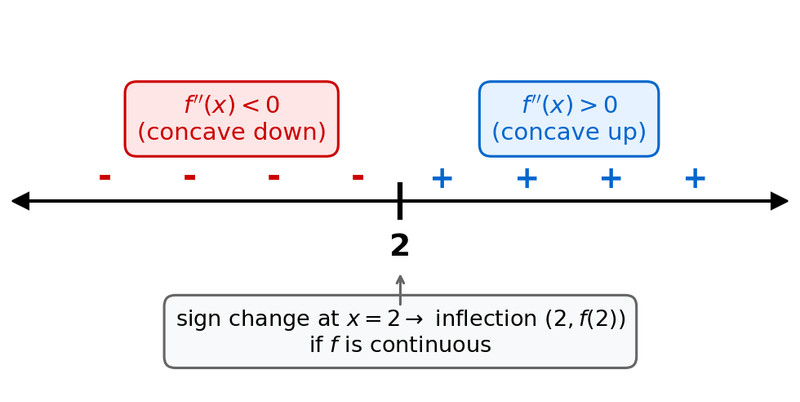
Sign chart for showing a change at
If there’s no sign change, it is not an inflection point.
Interpreting Graphs and Tables
Sometimes you won’t have a formula.
If given a graph of :
- increasing → concave up
- decreasing → concave down
You are watching the slope graph bend.
If given a table of values:
- Increasing numerical values → concave up
- Decreasing numerical values → concave down
You are analyzing trends, not just signs.
This shows up often in calculator-active FRQs where you justify using a table.
Common Mix-Ups
- means increasing, not concave up.
- Local max/min come from , not .
- Inflection requires a sign change, not just .
- Concavity is described on open intervals.
