Topic 2.4 Notes – Ecological Tolerance
What Ecological Tolerance Is
Ecological tolerance means the range of conditions an organism can endure. This can describe one individual organism or a species as a whole.
A big point here is that tolerance is factor-specific. An organism does not have one overall “tolerance.” It has separate tolerances for different abiotic factors.
College Board’s named examples:
- Temperature affects metabolism, enzyme activity, photosynthesis, and respiration. If temperature gets too low, processes slow down. If it gets too high, proteins and membranes can be damaged.
- Salinity is the amount of dissolved salt. It affects water balance and ion regulation, so the wrong salinity can make cells gain or lose too much water.
- Flow rate matters in moving water. It affects how much energy an organism needs to stay in place, plus oxygen and food delivery.
- Sunlight affects photosynthesis, temperature, and activity patterns. Too little limits producers. Too much can raise heat and water loss.
The main pattern is simple. Where conditions are favorable, organisms are often abundant. Where conditions cause stress, they are less common. Where conditions exceed limits, they are absent.
Range of Tolerance
Every tolerance range has a lower limit and an upper limit for one environmental factor. Performance is not the same across that whole range.
A tolerance curve helps you visualize the pattern from low population at the edges to greatest abundance in the optimum range.
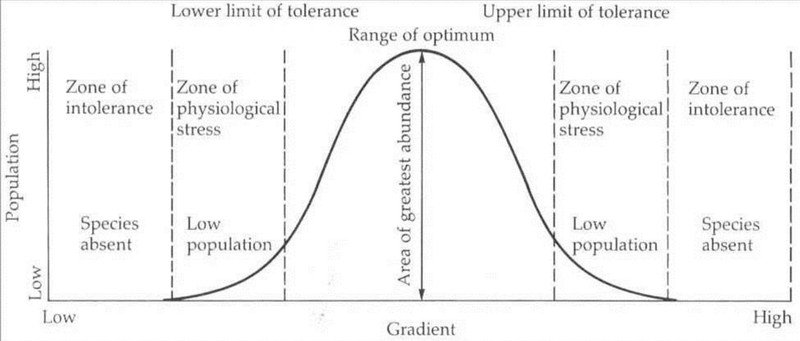
Ecological tolerance curve
Optimal range
This is where survival, growth, and reproduction are highest. You usually find the greatest abundance here. The optimum is usually a range, not one exact number.
Zones of physiological stress
These are outside the optimum but still survivable. Organisms may stay alive, but growth, health, or reproduction drops. That is why fewer individuals are usually found there.
Zones of intolerance
These are beyond the limits. Injury or death results, so the organism cannot persist there.
Limits of the model
- Tolerance curves are conceptual, not perfect real-life shapes.
- They do not have to be symmetrical.
- The survival range can be wider than the reproductive range.
- Exact boundaries may be gradual instead of sharp.
How Tolerance Affects Survival and Distribution
As conditions move away from the optimum, organisms experience stress. They use more energy to keep internal conditions stable, so less energy is left for growth and reproduction.
That is why populations can decline before conditions become immediately lethal.
- Adults may survive, but eggs, larvae, or juveniles may die.
- Reproduction may drop even when survival continues.
- If a limit is passed, organisms that cannot move away die.
- Mobile organisms may leave, causing local disappearance.
Broad and narrow tolerance matter too:
- Broad tolerance means a species can persist across a wider range of conditions.
- Narrow tolerance means it can persist only across a smaller range.
- Broad tolerance for one factor does not mean broad tolerance for all factors.
Tolerance helps explain possible distribution, but not total distribution. Food, water, shelter, breeding sites, competition, predation, disease, and dispersal barriers also affect where a species actually lives. This is a common AP trap.
Individuals, Species, and Interacting Factors
Individuals and species
Individual organisms have their own physiological limits. Tolerance can vary with:
- age
- life stage
- health
- nutrition
- previous exposure
A species-level tolerance range is a summary of the ranges shown by its members. Individuals are not identical, and different populations of the same species may differ too.
Acclimation
Acclimation is a reversible adjustment during an individual’s lifetime. It can shift tolerance somewhat, but only within limits. It is not genetic adaptation.
Multiple environmental factors
Organisms experience many factors at once. All essential conditions must stay within tolerable limits. One limiting factor can restrict survival even if other conditions are favorable.
A classic interaction is high temperature + low dissolved oxygen. Warm water increases oxygen demand and holds less oxygen, so low oxygen becomes more harmful.
How to Read Tolerance Data and Claims
In experiments, one environmental factor is changed while others are kept as constant as possible. Then scientists measure survival, growth, reproduction, or behavior. Replication matters because individuals vary.
Reading a graph
- Highest performance shows the observed optimal range.
- Lower performance with survival shows physiological stress.
- No survival shows intolerance.
- If one value has survivors and the next does not, you only know the limit lies between them.
- On a two-species graph, curve width shows broad vs. narrow tolerance.
- Curve position shows which conditions each species favors or endures.
Claim and evidence
A claim says a changed environmental factor caused stress, reduced performance, or population decline.
Evidence is the graph, table, or observation that shows the response.
A strong explanation connects the whole chain:
- An environmental factor changes.
- Conditions move away from the optimum or past a limit.
- Stress, reduced growth/reproduction, injury, or death occurs.
- Abundance or local distribution changes.
Key Takeaways
Ecological Tolerance / Tolerance Range
The factor-specific range of environmental conditions an individual organism or species can endure before injury or death results
Tolerance Limit
The lower or upper boundary of a tolerance range; beyond it, an organism cannot persist
Optimal Range / Optimum Zone
The range of conditions in which survival, growth, and reproduction are most successful and abundance is generally highest
Ecological Stress / Physiological Stress
Reduced biological performance when conditions leave the optimal range but remain survivable
Zone of Intolerance
Conditions beyond a lower or upper tolerance limit where injury or death prevents organisms from persisting
Tolerance Curve
A graph of biological performance or abundance across levels of an environmental factor, usually peaking in the optimal range and declining toward the limits
Broad vs. Narrow Tolerance Ranges
Broad tolerance permits persistence across a wide span of a factor; narrow tolerance permits persistence only across a restricted span
Acclimation
A reversible physiological or behavioral adjustment to changed conditions during an individual organism’s lifetime
Notes
Ecological Tolerance / Tolerance Range
The factor-specific range of environmental conditions an individual organism or species can endure before injury or death results
Tolerance Limit
The lower or upper boundary of a tolerance range; beyond it, an organism cannot persist
Optimal Range / Optimum Zone
The range of conditions in which survival, growth, and reproduction are most successful and abundance is generally highest
Ecological Stress / Physiological Stress
Reduced biological performance when conditions leave the optimal range but remain survivable
Zone of Intolerance
Conditions beyond a lower or upper tolerance limit where injury or death prevents organisms from persisting
Tolerance Curve
A graph of biological performance or abundance across levels of an environmental factor, usually peaking in the optimal range and declining toward the limits
Broad vs. Narrow Tolerance Ranges
Broad tolerance permits persistence across a wide span of a factor; narrow tolerance permits persistence only across a restricted span
Acclimation
A reversible physiological or behavioral adjustment to changed conditions during an individual organism’s lifetime
