Topic 6.2 Notes – Global Energy Consumption
What Global Energy Consumption Means
Energy consumption is the amount of energy used over time by a person, a country, or the whole world. That energy goes into a lot of different jobs:
- Transportation such as cars, trucks, ships, and planes
- Industry such as factories, steelmaking, and cement production
- Electricity generation for homes, businesses, and industry
- Heating and cooling in buildings
- Agriculture such as machinery and irrigation
- Residential and commercial use like lighting, appliances, offices, schools, and stores
The global energy mix is the combination of sources used to meet that demand.
- Fossil fuels
- Coal
- Petroleum
- Natural gas
- Non-fossil sources
- Nuclear energy
- Hydropower
- Wind
- Solar
- Geothermal energy
- Biomass
The most important global pattern is that fossil fuels dominate overall energy use. Watch the wording here. Fossil fuels dominate as a group. On a graph, oil, coal, and natural gas may be split into separate categories, so one single fossil fuel does not have to be the biggest band for that statement to still be true.
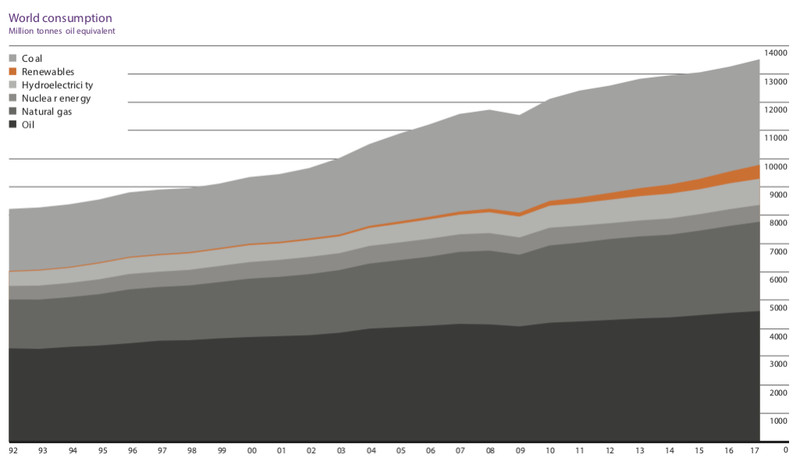
World energy consumption by source
One AP trap is mixing up primary energy and electricity. Primary energy is energy in the original source, like coal or sunlight. Electricity is a secondary form made from primary sources. So a graph about electricity generation does not automatically tell you the pattern for total global energy use.
How Energy Use Is Distributed
Energy use is unevenly distributed between developed and developing countries.
Developed countries usually have higher per-capita energy consumption because people often have:
- higher incomes
- more cars and appliances
- more heating and air conditioning
- larger homes and buildings
- more manufactured goods
Developing countries usually have lower per-capita energy consumption because of:
- lower incomes
- less access to modern commercial energy
- energy poverty, which means limited access to affordable, reliable modern energy
- some use of traditional biomass such as firewood, charcoal, crop residues, and animal dung
The math here matters:
That explains a common graph pattern:
- A large developing country can have very high total energy use because its population is huge.
- A smaller developed country can have lower total use but very high per-capita use.
When you read a graph or map, always check three things:
- total or per capita
- all energy or electricity only
- units and time period
Development and Industrialization Increase Demand
As countries industrialize and incomes rise, energy demand increases. That happens for three linked reasons:
Industrial growth
Factories, machinery, steel, cement, and raw-material processing all need large energy inputs.
Urbanization and rising income
More people use electricity, refrigeration, heating, cooling, and consumer products.
Transportation growth
Development usually brings more motorcycles, cars, trucks, and air travel.
A common pattern is a shift from traditional biomass to commercial energy, and that usually means more use of coal, petroleum, and natural gas because the infrastructure already exists. It is a general trend, not a rule every country follows exactly.
What Determines Which Energy Sources Are Used
Three main factors shape energy choices.
Availability
Countries use sources they can access, such as coal, oil, natural gas, rivers, wind, sunlight, biomass, or geothermal heat. Availability also means infrastructure like mines, wells, pipelines, refineries, power plants, and transmission lines.
Price
Energy choices depend on extraction, transport, construction, operation, and fuel costs. Lower prices usually increase use. Higher prices can push conservation or switching. Price also misses external costs like pollution and climate impacts.
Government regulations and policies
Governments can shift energy use through:
- subsidies or tax incentives
- taxes or fees on fuels or emissions
- renewable electricity requirements
- fuel-economy and appliance-efficiency standards
- building codes
- pollution limits
- restrictions on extraction or plant construction
- public investment in grids, transit, or research
Trends, Graphs, and Common Calculations
The trends to lock in are:
- Fossil fuels still dominate globally
- Global energy demand rises over time
- Developed countries usually use more energy per person
- Developing countries often increase total demand quickly as they industrialize
Common visuals:
- Stacked-area graph shows total demand growing if the full height rises
- Bar graph by country may show total or per-capita use
- Scatterplot of income vs energy use per person usually shows a positive relationship
- Choropleth map must be read with the legend
Unit reminders:
- Joule = energy
- Watt = joules per second, so it measures power
- Prefixes include kilo, mega, giga, tera, peta, exa
Key Takeaways
Energy Consumption
The amount of energy used by a person, sector, country, or the world during a specified period
Global Energy Mix
The combination of fossil fuels, nuclear energy, and renewable sources used worldwide; fossil fuels collectively supply most global energy
Energy Poverty
Inadequate access to affordable, reliable modern energy services
Industrial Sector
Energy use for manufacturing, machinery, high-temperature heat, fuel refining, and raw-material processing
Transportation Sector
Energy used to move people and goods, supplied mainly by petroleum-derived fuels such as gasoline, diesel, and jet fuel
Residential Sector
Energy used in homes for heating, cooling, water heating, lighting, cooking, refrigeration, and appliances
Commercial Sector
Energy used in service buildings such as offices, schools, hospitals, stores, and hotels
Agricultural Sector
Energy used for farm machinery, irrigation, fertilizer production, food processing, and transportation
External Costs
Environmental or public-health costs not included in an energy source's market price
Primary Energy
Energy in an original source before conversion to another form
Secondary Energy
Energy produced by converting primary energy; electricity is a secondary energy form
Commercial Energy
Energy that is bought and sold, such as electricity, gasoline, coal, or natural gas
Subsistence (Traditional) Energy
Energy gathered or produced locally for direct use and often undercounted in market statistics
Total Energy Consumption
Energy used by an entire population; total consumption = population × energy consumption per person
Per-Capita Energy Consumption
Average energy use per person; per-capita consumption = total energy consumption ÷ population
Notes
Energy Consumption
The amount of energy used by a person, sector, country, or the world during a specified period
Global Energy Mix
The combination of fossil fuels, nuclear energy, and renewable sources used worldwide; fossil fuels collectively supply most global energy
Energy Poverty
Inadequate access to affordable, reliable modern energy services
Industrial Sector
Energy use for manufacturing, machinery, high-temperature heat, fuel refining, and raw-material processing
Transportation Sector
Energy used to move people and goods, supplied mainly by petroleum-derived fuels such as gasoline, diesel, and jet fuel
Residential Sector
Energy used in homes for heating, cooling, water heating, lighting, cooking, refrigeration, and appliances
Commercial Sector
Energy used in service buildings such as offices, schools, hospitals, stores, and hotels
Agricultural Sector
Energy used for farm machinery, irrigation, fertilizer production, food processing, and transportation
External Costs
Environmental or public-health costs not included in an energy source's market price
Primary Energy
Energy in an original source before conversion to another form
Secondary Energy
Energy produced by converting primary energy; electricity is a secondary energy form
Commercial Energy
Energy that is bought and sold, such as electricity, gasoline, coal, or natural gas
Subsistence (Traditional) Energy
Energy gathered or produced locally for direct use and often undercounted in market statistics
Total Energy Consumption
Energy used by an entire population; total consumption = population × energy consumption per person
Per-Capita Energy Consumption
Average energy use per person; per-capita consumption = total energy consumption ÷ population
