Topic 3.4 Notes – Carrying Capacity
What Carrying Capacity Is
Carrying capacity is the largest population of a particular species that a particular environment can support over the long term under given conditions. Its symbol is .
A few details matter a lot here:
- It applies to a specific population in a specific habitat. You would talk about the carrying capacity of deer in one forest, not “the carrying capacity of deer” everywhere.
- Long term is the key phrase. A population can spike for a short time by using stored food, groundwater, or other resources. That temporary peak is not the same as carrying capacity.
- is a population size, measured in individuals. It is not a growth rate.
- When a population stays near , births and immigration are roughly balanced by deaths and emigration.
You also need the graph shapes from earlier population growth topics:
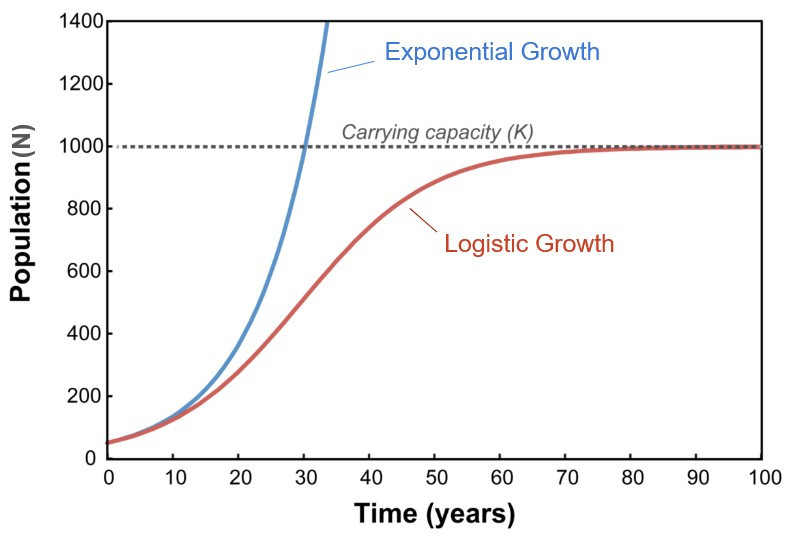
- Exponential growth is J-shaped
- Logistic growth is S-shaped and levels off near
This graph puts those two patterns side by side, with the logistic curve flattening as it approaches carrying capacity.
What Determines Carrying Capacity
Carrying capacity comes from limiting factors and the amount of environmental support available. If a resource or condition is in short supply, it limits how many individuals can survive.
Limiting resources and conditions
- Food or nutrients for energy and growth
- Water for all organisms
- Light for photosynthetic organisms
- Oxygen especially in aquatic systems or crowded habitats
- Shelter, nesting sites, and suitable habitat
- Territory and physical space
- Temperature and other abiotic conditions such as salinity or soil quality
Biotic factors
Other living things also help set the limit:
- Competition reduces access to resources
- Predation removes individuals
- Parasitism weakens hosts
- Disease spreads more easily in crowded populations
Carrying capacity is also species-specific. The same habitat can support very different numbers of rabbits, hawks, and oak trees because they need different things.
It can also change over time.
- can increase with habitat restoration, more rainfall, greater food availability, or more nesting sites.
- can decrease with drought, severe winters, habitat loss, pollution, soil degradation, prey depletion, or loss of shelter and breeding sites.
A population can end up above in two ways:
- The population grows while stays about the same.
- drops suddenly while the population stays temporarily high.
How Carrying Capacity Appears on Graphs
On population graphs, time is on the x-axis and population size is on the y-axis. Carrying capacity is often drawn as a horizontal line labeled .
The relationship you need to read is:
That means the population size is above carrying capacity.
- If , the environment could potentially support more individuals under those conditions.
- If stays near , population size is approximately stable.
- If , overshoot is happening.
A plateau can help you estimate if conditions are fairly stable. One common mistake is picking the highest point on a graph and calling it carrying capacity. That highest point may just be the peak of an overshoot.
Real populations usually fluctuate above and below . They do not stay perfectly flat because resources and population responses change over time.
Overshoot and Dieback
These two terms are connected, but they are not the same thing.
Overshoot
Overshoot happens when population size exceeds carrying capacity. During overshoot, resources are used faster than they can be replaced.
Why it happens:
- Populations do not respond instantly to declining resources
- Reproduction may continue even after shortages begin
Environmental effects include:
- resource depletion
- overgrazing or vegetation loss
- habitat degradation
- increased competition
- waste buildup
- more stress and disease vulnerability
- harm to other species using the same resources
Overshoot can even lower future carrying capacity if the habitat gets damaged.
Dieback
Dieback is a rapid, substantial population decline after severe overshoot.
Major causes:
- famine
- disease
- conflict over scarce resources
These raise mortality and lower reproduction. After dieback, a population might:
- stabilize near
- keep oscillating above and below
- drop to a new, lower
- disappear locally
The causal chain matters on tests:
- population grows above
- resources are depleted and competition increases
- famine, disease, and/or conflict rise
- mortality rises or reproduction falls
- dieback follows
Classic Example and Data Interpretation
The St. Matthew Island reindeer case is the classic example. The graph makes the overshoot-and-dieback pattern easy to see at a glance.
- 1944: 29 reindeer introduced
- 1957: about 1,350
- 1963: about 6,000
- 1966: only 42 remained
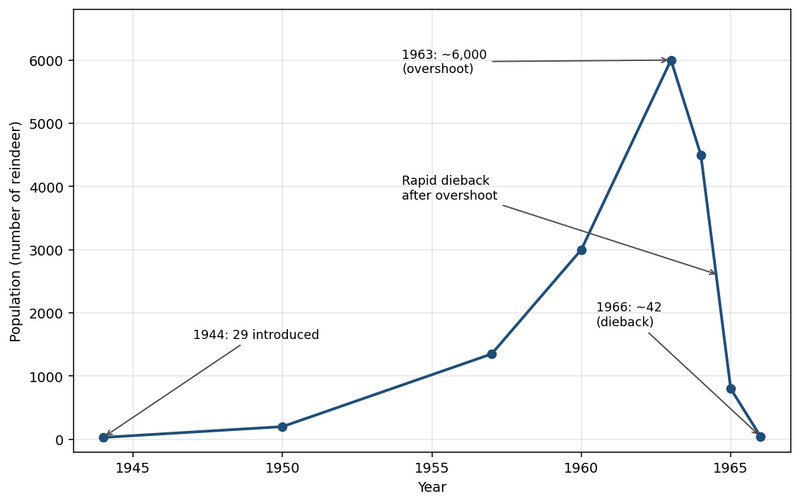
St. Matthew Island reindeer population, 1944-1966
Why the crash happened:
- abundant lichen at first
- no major predators
- reindeer overused the lichen
- severe winter weather made the food shortage worse
So the 1963 peak was the overshoot, and the sharp drop after it was the dieback.
This example shows a major exam point. The highest observed population is not automatically carrying capacity.
When you read data, connect the pattern to the cause:
- Overshoot suggests unsustainable resource use
- Dieback suggests resource shortage and increased mortality
- If habitat was damaged, may be lower after the crash
Key Takeaways
Carrying Capacity
The largest population of a species that an environment can sustain over the long term under given conditions; represented by K.
Population Overshoot
The condition in which population size exceeds carrying capacity (N > K), often causing resource depletion and environmental damage
Dieback (Population Crash or Die-Off)
A rapid, substantial population decline that may follow overshoot as resource scarcity causes famine, disease, conflict, or reduced reproduction
Notes
Carrying Capacity
The largest population of a species that an environment can sustain over the long term under given conditions; represented by K.
Population Overshoot
The condition in which population size exceeds carrying capacity (N > K), often causing resource depletion and environmental damage
Dieback (Population Crash or Die-Off)
A rapid, substantial population decline that may follow overshoot as resource scarcity causes famine, disease, conflict, or reduced reproduction
