Topic 3.8 Notes – Human Population Dynamics
What Human Population Dynamics Are
A population is just a group of people in a defined area. Its size changes through four processes:
- Births add people
- Deaths remove people
- Immigration adds people entering
- Emigration removes people leaving
The population balance is
If births + immigration are greater, the population grows. If deaths + emigration are greater, it shrinks. If they are about equal, it stays fairly stable.
Migration depends on scale:
- For a city or country, migration can change population a lot.
- For the whole world, migration changes nothing overall because people are only moving from one place to another. Global population changes only through births and deaths.
A quick link to earlier ecology. Humans still face finite resources and carrying capacity, which means the environment can only support so many people over time. Human carrying capacity is more flexible because technology, trade, sanitation, and policy can change access to resources.
Rates Used to Measure Population Change
Raw totals tell you how many people there are. Rates let you compare different populations fairly.
Birth and death rates
- Crude birth rate (CBR) = births per year per 1,000 people
- Crude death rate (CDR) = deaths per year per 1,000 people
- Crude means these rates are not adjusted for age structure
Rate of natural increase
RNI measures change from births and deaths only.
- positive RNI = natural increase
- zero RNI = no natural increase
- negative RNI = natural decrease
This is a common AP trap. RNI does not include migration.
- Negative RNI + high immigration = population can still grow
- Positive RNI + high emigration = population can still shrink
Percent change and doubling time
If you only have starting and ending population:
That is only an annual growth rate if the time period is one year.
For doubling time:
Use RNI only if the question asks about natural increase. Use total growth rate if migration is included. The rule of 70 only works for positive, fairly constant growth.
What Changes Birth and Death Rates
Birth and death rates are shaped by social and environmental conditions.
- Education
Education, especially for girls and women, often lowers birth rates by delaying marriage and childbirth and increasing job options.
- Family planning
Access to contraception, reproductive healthcare, and information usually lowers unintended pregnancies and birth rates.
- Healthcare and sanitation
Vaccines, safer childbirth, disease treatment, clean water, and sewage systems lower death rates. If death rates fall before birth rates do, population growth can rise quickly.
- Nutrition and food security
Good nutrition lowers mortality. Food insecurity raises death rates, weakens immune systems, and can increase infant mortality.
For most of history, human population growth was slow because high birth rates were canceled out by high death rates. Agriculture, then industrialization, sanitation, medicine, and better food production lowered death rates. You can see that pattern in the graph below, where the world population stays relatively low for centuries and then rises steeply in the modern era. That is why the global human population curve is often J-shaped.
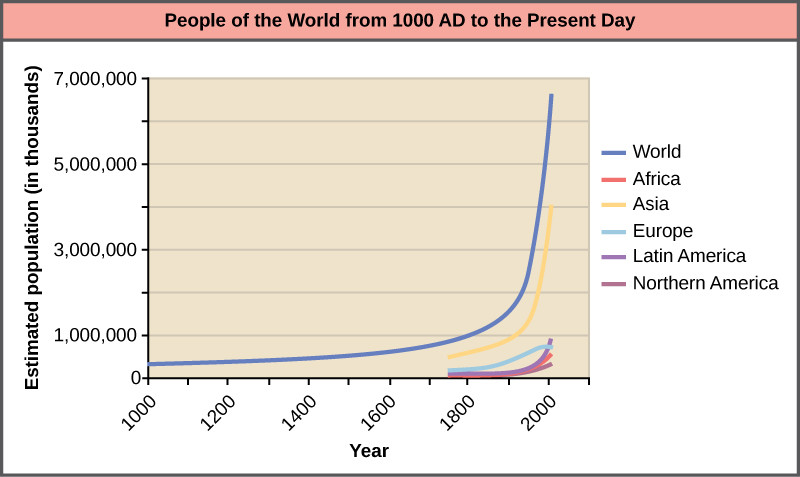
Human population growth over time
Limits on Human Population Growth
Two kinds of limiting factors show up here.
Density-Dependent Factors
These get stronger as population density increases.
- clean water and clean air become harder to provide
- food becomes more competitive
- disease spreads more easily
- territory and space become limited
- competition for resources increases
Density-Independent Factors
These affect populations regardless of density.
- major storms
- fires
- heat waves
- droughts
They can connect back to density-dependent effects. A storm can damage infrastructure, which can then increase crowding and disease.
Carrying capacity is the maximum population the environment can support over time without exhausting resources or damaging life-support systems. For humans, it depends on freshwater, food, soil, energy, raw materials, space, waste absorption, and ecosystem function.
Overshoot happens when population and resource use exceed carrying capacity. That can lead to depletion, pollution, conflict, migration, lower birth rates, higher death rates, and decline.
Malthusian theory says population can grow faster than food supply. Malthus argued that famine, disease, and conflict act as limits. The APES takeaway is simple. Exponential growth cannot continue forever on a finite planet.
How to Read Population Questions and Graphs
This is where a lot of mistakes happen.
- A rising population size does not always mean the growth rate is rising.
- A falling birth rate does not automatically mean population decline.
- The gap between birth rate and death rate shows natural increase.
- Always check units. Per 1,000 is different from percent.
- Population momentum means a population can keep growing after fertility falls if it has many young people entering reproductive years.
Key Takeaways
Population Balance
Population change is ΔN = (B + I) − (D + E): births and immigration add people, while deaths and emigration remove them
Crude Birth Rate (CBR)
The number of live births per 1,000 people in a population per year
Crude Death Rate (CDR)
The number of deaths per 1,000 people in a population per year
Rate of Natural Increase (RNI)
The annual rate of population change from births and deaths alone; RNI (%) = (CBR − CDR) ÷ 10 when rates are per 1,000
Doubling Time (Rule of 70 Estimate)
The estimated years for a population to double: 70 ÷ annual percentage growth rate, assuming a positive, approximately constant rate
Family Planning
Access to contraception, reproductive healthcare, and information that allows people to choose the timing and number of births
Density-Dependent Limiting Factor
A factor whose effect strengthens as population density rises, such as competition, food or water scarcity, disease transmission, or limited space
Density-Independent Limiting Factor
A factor whose occurrence or basic effect is not caused by population density, such as a major storm, wildfire, heat wave, or drought
Human Carrying Capacity
The maximum human population an environment can support over time without exhausting its resources and life-support systems; exceeding it causes overshoot
Malthusian Theory
Malthus's theory that population can grow exponentially faster than food supply, so finite resources eventually limit unchecked growth
Positive Checks vs. Preventive Checks
Positive checks raise death rates through famine, disease, or conflict; preventive checks reduce births through delayed marriage or restraint from childbearing
Notes
Population Balance
Population change is ΔN = (B + I) − (D + E): births and immigration add people, while deaths and emigration remove them
Crude Birth Rate (CBR)
The number of live births per 1,000 people in a population per year
Crude Death Rate (CDR)
The number of deaths per 1,000 people in a population per year
Rate of Natural Increase (RNI)
The annual rate of population change from births and deaths alone; RNI (%) = (CBR − CDR) ÷ 10 when rates are per 1,000
Doubling Time (Rule of 70 Estimate)
The estimated years for a population to double: 70 ÷ annual percentage growth rate, assuming a positive, approximately constant rate
Family Planning
Access to contraception, reproductive healthcare, and information that allows people to choose the timing and number of births
Density-Dependent Limiting Factor
A factor whose effect strengthens as population density rises, such as competition, food or water scarcity, disease transmission, or limited space
Density-Independent Limiting Factor
A factor whose occurrence or basic effect is not caused by population density, such as a major storm, wildfire, heat wave, or drought
Human Carrying Capacity
The maximum human population an environment can support over time without exhausting its resources and life-support systems; exceeding it causes overshoot
Malthusian Theory
Malthus's theory that population can grow exponentially faster than food supply, so finite resources eventually limit unchecked growth
Positive Checks vs. Preventive Checks
Positive checks raise death rates through famine, disease, or conflict; preventive checks reduce births through delayed marriage or restraint from childbearing
