Topic 5.11 Notes – Ecological Footprints
What Ecological Footprints Measure
An ecological footprint is the biologically productive land and water area needed to supply the resources a person or society uses and to absorb the wastes it produces.
That means it compares two big things at once:
- Resource demand which includes food, materials, energy, land, and goods
- Waste production which is especially important for carbon dioxide from fossil-fuel use
A footprint can describe an individual, household, city, country, or the whole world. The idea stays the same at every scale. Bigger footprint = more demand on ecosystems. Smaller footprint = less demand.
Two easy mistakes show up a lot on tests:
- It is not the same as the land a population physically lives on.
- It is not just a pollution total.
A city may cover a small area but still depend on huge areas of cropland, forests, fisheries, and carbon-absorbing ecosystems elsewhere. This connects back to carrying capacity, which is the maximum population an environment can support over time.
The Main Parts of an Ecological Footprint
Ecological footprints combine resource demand and waste production into one area-based measure.
Resource demand
This includes land or water needed for:
- Food production for crops and livestock feed
- Fiber and timber use for clothing, paper, wood, and other products
- Grazing for livestock on pasture or rangeland
- Fishing and aquatic harvest for fish and other aquatic organisms
- Housing, roads, and infrastructure such as buildings and transportation networks
- Goods and services which need energy and raw materials to be made, moved, and used
Waste production
The biggest piece is usually:
- Carbon dioxide from fossil-fuel combustion, translated into the forest area needed to absorb it
It can also reflect broader waste-related impacts from making, using, and throwing away products.
The six accounting categories
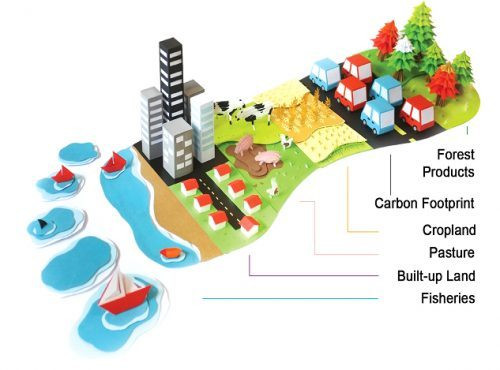
Ecological footprint data is commonly broken into six categories like the ones shown here.
Ecological footprint categories
- Cropland for crops, plant fibers, livestock feed, and some biofuels
- Grazing land for pasture and rangeland
- Fishing grounds for harvested aquatic organisms
- Forest-product land for timber, paper, and forest products
- Built-up land for settlements and infrastructure
- Carbon uptake land for the estimated forest area needed to absorb fossil-fuel CO2
Units and reporting
Footprints are usually measured in hectares or global hectares (gha). A global hectare is one hectare of biologically productive land or water with world-average productivity.
You might see footprint data reported as:
- Total gha
- Gha per person
- Earth-equivalents
- Category breakdowns
Variables That Change Footprint Size
The main drivers are easy to group together:
Food and diet
Meat-heavy diets usually increase footprints, especially beef and other ruminants, because energy is lost between trophic levels. Food waste also raises footprints because resources were used for food that was never eaten.Transportation
Vehicle type, fuel efficiency, travel distance, passengers, public transit use, and air travel all matter. Frequent flying and inefficient fossil-fuel vehicles usually make the carbon part much larger.Housing and household energy
Home size, number of occupants, insulation, heating and cooling, electricity use, and energy source all affect footprint size. Large homes with few occupants usually have a larger per-person footprint.Goods and services
More buying means more materials and energy use. Repair, reuse, durable products, and secondhand purchases lower demand.Waste
Disposable products and lots of packaging increase footprint. Recycling and composting help, but waste prevention helps most.Population and consumption per person
A country can have a high total footprint because it has many people, a high per-capita footprint because each person consumes a lot, or both.
Biocapacity and How to Interpret Footprint Data
Biocapacity is the ability of productive land and water to generate renewable resources and absorb wastes.
- Ecological reserve means biocapacity is greater than footprint.
- Ecological deficit means footprint is greater than biocapacity.
- Global overshoot means humanity’s total demand exceeds Earth’s total biocapacity.
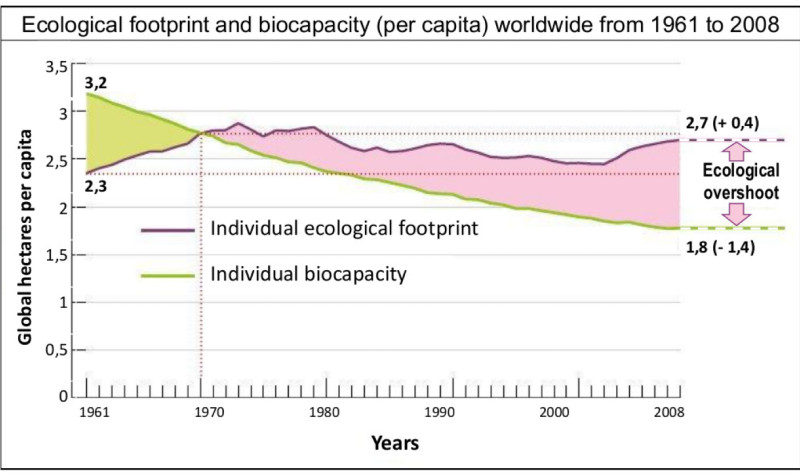
This pattern often appears in line graphs like the one below, where the per-capita ecological footprint rises above per-capita biocapacity around 1970 and stays higher afterward.
Global ecological footprint and biocapacity per person, 1961 to 2008
Consumption is often counted by what people use, not only what a country produces:
When reading footprint graphs, keep the labels straight:
- Check whether the graph shows total footprint or per-capita footprint.
- In a stacked bar graph, total bar height is total footprint and each segment is one category.
- A large carbon segment usually means fossil-fuel use is the main driver.
- In a line graph, footprint above biocapacity means deficit.
- On a map, read the legend carefully. It may show per-capita footprint, total footprint, or deficit.
Why Ecological Footprints Matter and Their Limits
Ecological footprints matter because they combine many kinds of human demand into one measure and compare that demand with available biocapacity.
A few limits matter too:
- Affluence often goes with larger footprints, but income alone does not determine footprint size.
- A carbon footprint is only greenhouse gas emissions. An ecological footprint is broader.
- Ecological footprints do not fully capture toxicity, biodiversity loss, freshwater scarcity, soil degradation, unequal impacts, or all nonrenewable resource depletion.
On FRQs and data questions, explain why a footprint is larger by linking it to resource demand and waste production, not by only saying the number is bigger.
Key Takeaways
Ecological Footprint
The biologically productive land and water area needed to supply an individual’s or society’s renewable resources and absorb its wastes under prevailing technology and management
Cropland
The ecological-footprint category for land that supplies crops, plant fibers, livestock feed, and some biofuels
Grazing Land
The ecological-footprint category for pasture or rangeland used to support livestock
Fishing Grounds
The ecological-footprint category for productive aquatic areas that supply harvested fish and other aquatic organisms
Forest-Product Land
The ecological-footprint category for forest area needed to supply timber, paper, and other forest products
Built-Up Land
The ecological-footprint category for productive land covered by settlements, roads, and other infrastructure
Carbon Uptake Land
The estimated forest area needed to absorb fossil-fuel carbon dioxide emissions not otherwise absorbed, especially by oceans
Total vs. Per-Capita Ecological Footprint
Total footprint measures a population’s combined demand; per-capita footprint measures average demand per person, with total footprint = population × footprint per person
Global Hectare (gha)
One hectare of biologically productive land or water with world-average productivity in a given year
Consumption-Based Accounting
Assigns ecological demand to consumers: consumption footprint = domestic-production footprint + footprint embodied in imports − footprint embodied in exports
Biocapacity
The capacity of biologically productive land and water to generate renewable resources and absorb wastes
Ecological Balance
Biocapacity − ecological footprint; a positive value indicates a reserve and a negative value indicates a deficit
Ecological Reserve vs. Ecological Deficit
A reserve occurs when biocapacity exceeds ecological footprint; a deficit occurs when ecological footprint exceeds biocapacity
Demand-to-Capacity Ratio
Ecological footprint ÷ biocapacity; a value above 1 indicates demand exceeds capacity, while a value below 1 indicates demand is below capacity
Ecological Overshoot
The global condition in which humanity’s ecological footprint exceeds Earth’s biocapacity
Carbon Footprint
A measure of greenhouse gas emissions, usually reported in carbon dioxide equivalents
Water Footprint
A related indicator of water consumed or polluted, rather than the biologically productive area measured by an ecological footprint
Notes
Ecological Footprint
The biologically productive land and water area needed to supply an individual’s or society’s renewable resources and absorb its wastes under prevailing technology and management
Cropland
The ecological-footprint category for land that supplies crops, plant fibers, livestock feed, and some biofuels
Grazing Land
The ecological-footprint category for pasture or rangeland used to support livestock
Fishing Grounds
The ecological-footprint category for productive aquatic areas that supply harvested fish and other aquatic organisms
Forest-Product Land
The ecological-footprint category for forest area needed to supply timber, paper, and other forest products
Built-Up Land
The ecological-footprint category for productive land covered by settlements, roads, and other infrastructure
Carbon Uptake Land
The estimated forest area needed to absorb fossil-fuel carbon dioxide emissions not otherwise absorbed, especially by oceans
Total vs. Per-Capita Ecological Footprint
Total footprint measures a population’s combined demand; per-capita footprint measures average demand per person, with total footprint = population × footprint per person
Global Hectare (gha)
One hectare of biologically productive land or water with world-average productivity in a given year
Consumption-Based Accounting
Assigns ecological demand to consumers: consumption footprint = domestic-production footprint + footprint embodied in imports − footprint embodied in exports
Biocapacity
The capacity of biologically productive land and water to generate renewable resources and absorb wastes
Ecological Balance
Biocapacity − ecological footprint; a positive value indicates a reserve and a negative value indicates a deficit
Ecological Reserve vs. Ecological Deficit
A reserve occurs when biocapacity exceeds ecological footprint; a deficit occurs when ecological footprint exceeds biocapacity
Demand-to-Capacity Ratio
Ecological footprint ÷ biocapacity; a value above 1 indicates demand exceeds capacity, while a value below 1 indicates demand is below capacity
Ecological Overshoot
The global condition in which humanity’s ecological footprint exceeds Earth’s biocapacity
Carbon Footprint
A measure of greenhouse gas emissions, usually reported in carbon dioxide equivalents
Water Footprint
A related indicator of water consumed or polluted, rather than the biologically productive area measured by an ecological footprint
