Topic 3.7 Notes – Total Fertility Rate
What Total Fertility Rate Is
Total fertility rate means the average number of children a woman is expected to have over her reproductive lifetime. It is measured in children per woman.
A few details matter here:
- TFR is a population average, based on age-specific fertility rates at a given time.
- It is not a percent.
- It is not births per year.
- It helps predict whether a population is likely to grow, stabilize, or decline over time.
Quick distinctions that get mixed up a lot:
- Crude birth rate = births per 1,000 people per year
- Fecundity = biological ability to reproduce
- Infant mortality rate = deaths of infants under age 1 per 1,000 live births
One exam trap is treating TFR like instant population growth. It doesn’t work that way by itself because age structure and migration also matter.
Replacement-Level Fertility and What It Means
Replacement-level fertility is the TFR at which a population replaces itself. In APES, use about 2.1 children per woman.
Why 2.1 instead of 2.0?
- Some children do not survive to reproductive age.
- Some adults do not reproduce.
That gives you the basic pattern:
- Above 2.1 → long-term population growth
- Near 2.1 → relatively stable population
- Below 2.1 → long-term population decline
Population pyramids help you connect that fertility pattern to what a country's age structure looks like over time.
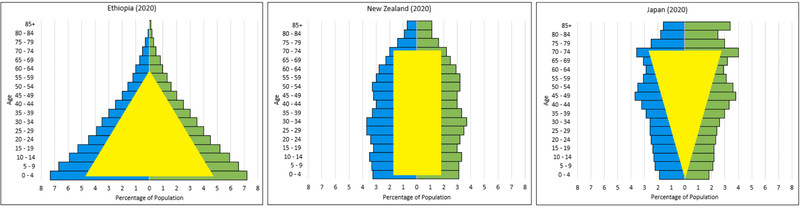
Population pyramids for growing, stable, and declining populations
In this figure, Ethiopia has the broad base of a fast-growing population, New Zealand is closer to stable, and Japan shows the narrower base and older age structure of a declining population.
This rule has limits. If a country has many young people, it can keep growing even after TFR reaches replacement level. That is population momentum. If a country has an older population, it may still shrink even if TFR rises.
Factors That Affect TFR
Age at first childbirth
Earlier first childbirth usually raises TFR because there is more time for additional births. Later first childbirth usually lowers TFR because the reproductive window is shorter, and later first births often go with wider birth spacing and smaller families.
Educational opportunities for females
More education usually lowers TFR. The main reasons connect together:
- marriage and first childbirth often happen later
- knowledge of contraception and healthcare increases
- job and income opportunities expand
- women usually gain more decision-making power over family size
- the opportunity cost of having many children rises
Access to family planning
Access to contraception, counseling, and reproductive healthcare usually lowers TFR because people can prevent unintended pregnancies, delay first birth, space births, and stop at their desired family size.
Effective access depends on more than whether birth control exists:
- cost
- distance
- education
- legal restrictions
- cultural acceptance
Government acts and policies
Governments can push fertility down or up.
Antinatalist policies reduce fertility
Examples include contraception programs, incentives for smaller families, penalties or limits on family size, and campaigns encouraging later childbirth.
China’s One-Child Policy is the key example.Pronatalist policies increase fertility
Examples include tax benefits, child allowances, paid parental leave, subsidized childcare, and housing support.
Policy effects are often uneven because culture, economics, and age structure also shape family decisions.
Infant mortality patterns
High infant mortality often goes with high TFR because families may have more children when child survival is uncertain. Lower infant mortality can lead to lower TFR over time.
Major causes of infant mortality differences include:
- maternal healthcare access
- prenatal care
- nutrition
- skilled birth assistance
- neonatal care
- vaccinations and infection treatment
Development Patterns and Big Demographic Trends
Less economically developed countries often have higher TFR and higher infant mortality. More economically developed countries often have lower TFR, later first childbirth, better female education, stronger healthcare, and greater access to family planning.
That pattern is broad, not universal. Countries with similar income levels can still have different TFRs because of culture, policy, and social conditions.
How to Read TFR Data
You’ll usually see TFR in time-series graphs, maps, or country comparisons. This example is a time-series graph, so focus on the overall trend and how the lines compare with the 2.1 replacement-level line.
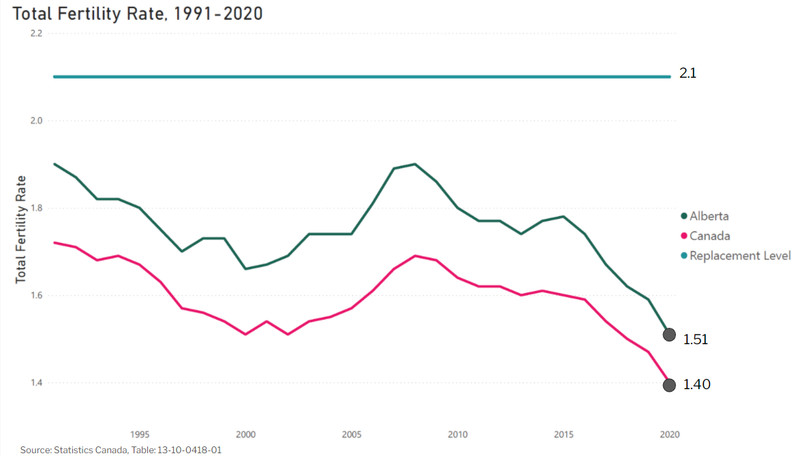
TFR time-series graph with replacement level
When reading data, separate description from explanation.
- Description says what happened
TFR increased, decreased, stayed similar, or fluctuated. - Explanation gives a reason
Link the trend to age at first childbirth, female education, family planning, policy, or infant mortality.
Always compare the value to 2.1.
- If TFR falls but stays above 2.1, population will likely still grow, just more slowly.
- If infant mortality falls, explain it with improved healthcare and nutrition, then connect that to possible later declines in TFR.
Keep the units straight:
- TFR = children per woman
- IMR = deaths under age 1 per 1,000 live births
Key Takeaways
Total Fertility Rate (TFR)
The average number of children a woman is expected to have over her reproductive lifetime, measured in children per woman
Replacement-Level Fertility
The TFR needed to replace the parental generation, approximately 2.1 children per woman; it tends toward long-term stability without net migration or major mortality changes
Population Momentum
Continued population growth after TFR reaches replacement level because a large young population is entering its reproductive years
Family Planning
Information, healthcare, contraception, and counseling that let people time, space, or limit births, generally lowering TFR when accessible
Antinatalist Policy
A government policy designed to reduce fertility by discouraging births or promoting smaller families
Pronatalist Policy
A government policy designed to increase fertility, often through financial benefits or support that reduces the costs of raising children
China's Former One-Child Policy
An antinatalist policy begun around 1979 that used birth limits, incentives, and penalties to reduce fertility and slow population growth
Infant Mortality Rate (IMR)
Deaths of infants under age one per 1,000 live births in a year; it generally falls with improved maternal healthcare and nutrition
Notes
Total Fertility Rate (TFR)
The average number of children a woman is expected to have over her reproductive lifetime, measured in children per woman
Replacement-Level Fertility
The TFR needed to replace the parental generation, approximately 2.1 children per woman; it tends toward long-term stability without net migration or major mortality changes
Population Momentum
Continued population growth after TFR reaches replacement level because a large young population is entering its reproductive years
Family Planning
Information, healthcare, contraception, and counseling that let people time, space, or limit births, generally lowering TFR when accessible
Antinatalist Policy
A government policy designed to reduce fertility by discouraging births or promoting smaller families
Pronatalist Policy
A government policy designed to increase fertility, often through financial benefits or support that reduces the costs of raising children
China's Former One-Child Policy
An antinatalist policy begun around 1979 that used birth limits, incentives, and penalties to reduce fertility and slow population growth
Infant Mortality Rate (IMR)
Deaths of infants under age one per 1,000 live births in a year; it generally falls with improved maternal healthcare and nutrition
