Topic 4.3 Notes – Soil Composition and Properties
What Soil Is and Why Composition Controls Its Properties
Soil is not just dirt. It’s a mixture of:
- mineral particles from weathered rock
- organic matter such as dead plant material and humus (stable, decomposed organic material)
- water
- air
- living organisms like bacteria, fungi, insects, and earthworms
A productive surface soil is often shown as about:
- 45% mineral matter
- 25% water
- 25% air
- 5% organic matter
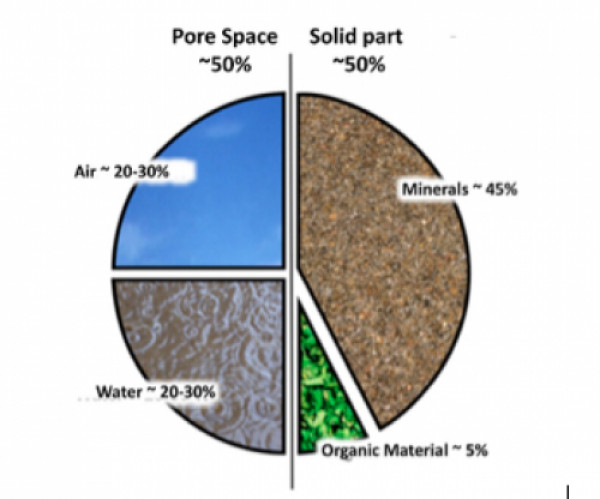
Idealized soil composition
This breakdown also helps you see that water and air share the same pore space, so they shift constantly. After rain, pores fill with more water. As soil dries, air moves back in. Compaction squeezes out pore space, which hurts both drainage and aeration.
A quick horizon reminder helps here. Different soil horizons can vary in particle size, organic matter, mineral content, porosity, permeability, and fertility. That’s why the topsoil and subsoil can behave very differently.
The big idea for this whole topic is simple. Soil composition controls water movement, nutrient availability, and productivity.
Soil Texture and the Main Soil Types
Texture means the relative percentages of sand, silt, and clay in the mineral part of soil. It does not mean structure. Structure is how particles clump into aggregates.
Sand, silt, and clay together
- Sand is to mm. It has the largest particles and feels gritty.
- Silt is to mm. It has medium particles and feels smooth, almost flour-like.
- Clay is less than mm. It has the smallest particles and feels sticky when wet.
Particle size matters because it affects surface area, pore size, and how strongly soil holds water and nutrients.
Property patterns by texture
- Sandy soils have large pores, high permeability, low water-holding capacity, low nutrient retention, and high leaching risk.
- Silty soils are in the middle. They feel smooth and usually have moderate water retention.
- Clay-rich soils have many tiny pores, slow water movement, high total water-holding capacity, and often higher nutrient retention. Some of that water is held too tightly for plants to use.
- Loam has a balanced mix of sand, silt, and clay. It usually gives the best mix of drainage, water retention, and nutrient retention.
The soil texture triangle
The soil texture triangle classifies soil using percent sand, silt, and clay.
Only two percentages are needed, because the third must make the total 100%. The triangle helps identify classes like sand, sandy loam, loam, clay loam, clay, and silt loam.
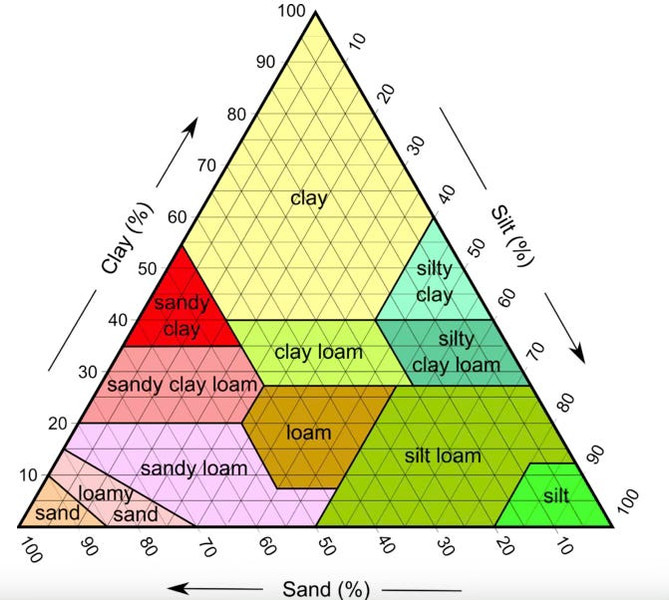
Soil texture triangle
Loam is the class you should care about most for productivity. In the triangle, it sits near the center because it represents a relatively balanced mix of sand, silt, and clay.
How Soil Properties Affect Water and Fertility
Porosity is how much pore space a soil has. Permeability is how easily water moves through connected pores. Those are related, but not the same. Clay can have high porosity and still low permeability because its pores are tiny.
Other key ideas:
- Infiltration means water entering the soil surface. It depends on texture, vegetation, slope, crusting, and compaction.
- Water-holding capacity means total water the soil can retain.
- Sandy soil drains fast and holds less water.
- Clay-rich soil holds more water, but some is unavailable to plants.
- Loam usually gives the best balance.
Fertility means the soil can provide nutrients and good growing conditions. It depends on:
- nutrient levels
- organic matter
- pH
- water availability
- aeration
- biological activity
- texture and structure
CEC, or cation exchange capacity, is the soil’s ability to hold positively charged nutrients such as K, Ca, Mg, and NH. Clay and humus usually raise CEC. Sandy soils usually have lower CEC and lose nutrients more easily by leaching.
pH also matters because it changes nutrient availability and microbial activity. Very acidic or very basic soils are less suitable for many crops.
Compaction is a classic APES cause-and-effect point. It lowers porosity, permeability, infiltration, and root growth, and it increases runoff.
Soil Testing and What the Results Are Used For
Soil quality is measured through physical, chemical, and biological tests together.
Physical tests
- Texture can be tested by feel or with a settling-jar test.
- Permeability can be compared by drainage through equal soil columns.
- Water-holding capacity can be tested by saturating, draining, and reweighing soils.
- Bulk density helps measure compaction.
Chemical tests
- pH is often tested with a soil-water slurry.
- Nutrient tests often look at nitrogen, phosphorus, and potassium.
- Other tests can measure salinity, organic matter, CEC, and contaminants.
Biological tests
- Organism abundance
- Microbial respiration through CO production
- Decomposition rate
- Root condition
How results guide decisions
- Irrigation depends on texture. Sandy soils often need smaller, more frequent watering. Clay soils need slower, less frequent watering.
- Fertilizer depends on deficiencies, but also on texture and CEC. Sandy soils have greater leaching risk, so timing matters.
- Amendments like compost improve water retention, aggregation, and biological activity.
The APES takeaway here is that no single test tells you overall soil quality. Texture, pH, permeability, CEC, organic matter, and biological activity work together.
Key Takeaways
Soil Composition
A mixture of mineral particles, organic matter, water, air, and organisms; idealized productive surface soil is 45% mineral matter, 25% water, 25% air, and 5% organic matter by volume
Soil Organic Matter
The living organisms, roots, recently dead material, and humus in soil that influence water retention, nutrient supply, and structure
Humus
Dark, relatively stable organic material formed by decomposition that helps soil retain water and nutrients and improves structure
Soil Texture
The relative percentages of sand, silt, and clay in the mineral portion of soil
Soil Structure
The way individual soil particles are grouped into aggregates, distinct from the particle percentages measured by texture
Sand
The largest mineral soil particles, 0.05–2.0 mm in diameter; sandy soils are generally highly permeable and retain little water or nutrients
Silt
Intermediate-sized mineral soil particles, 0.002–0.05 mm in diameter, that often feel smooth or flour-like when dry
Clay
The smallest mineral soil particles, less than 0.002 mm in diameter; clay-rich soils generally transmit water slowly and retain substantial water and nutrient cations
Macropores vs. Micropores
Macropores are large pores that transmit water rapidly; micropores are small pores that transmit water slowly and hold it more strongly
Porosity
The percentage of total soil volume occupied by pore space: pore-space volume ÷ total soil volume × 100
Soil Compaction
Compression of soil that destroys pore space, reducing porosity, permeability, infiltration, aeration, and root growth while increasing runoff
Bulk Density
Dry soil mass per total soil volume; a higher bulk density generally indicates greater compaction and less pore space
Permeability
The ability of soil to transmit water through connected pore spaces
Infiltration
The process by which water enters soil at its surface, influenced by texture, vegetation, crusting, slope, and compaction
Soil Permeability Test
Place equal soil depths in identical columns with the same packing, add equal water volumes, and compare drainage time or discharge per unit time; faster drainage indicates greater permeability
Water-Holding Capacity (Water Retention)
The total amount of water a soil can retain in its pores and on particle surfaces
Field Capacity
The amount of water remaining in soil after excess gravitational water has drained away
Permanent Wilting Point
The soil-water level at which plants can no longer extract enough water and remain wilted
Plant-Available Water
The water plants can extract from soil, equal to field capacity minus the permanent wilting point
Water-Holding Capacity Test
Dry equal soil masses, saturate and drain them identically, then calculate retained water as drained wet mass minus dry mass
Soil Fertility
The ability of soil to supply nutrients and other conditions needed for plant growth
Cation Exchange
The reversible transfer of positively charged nutrient ions between negatively charged soil particles and soil water
Cation Exchange Capacity (CEC)
A soil’s ability to hold and exchange nutrient cations; soils rich in clay and humus generally have higher CEC than sandy soils
Soil pH
A logarithmic measure of soil acidity or basicity that affects nutrient availability, microbial activity, and plant growth
Soil pH Test
Mix soil with distilled or deionized water at a consistent ratio, allow it to settle, and test the liquid with a calibrated probe or indicator
Soil Salinity
The concentration of dissolved salts in soil; high salinity interferes with plant water uptake and is often estimated by electrical conductivity
Mineralization
The conversion by soil organisms of nutrients in organic matter into inorganic forms that plants can absorb
Soil Respiration Test
Incubate equal masses of moist soil under controlled conditions and measure CO₂ released; greater release generally indicates greater biological activity
Soil Texture Triangle
A diagram that classifies mineral soil from sand, silt, and clay percentages summing to 100%; plot the three percentage lines and identify their textural region
Loam
A textural class containing a balanced mixture of sand, silt, and clay that commonly provides both water retention and drainage; it is not necessarily equal thirds
Settling-Jar Test
Mix soil with water and let it settle into sand, silt, and clay layers; each percentage is layer thickness ÷ total mineral-layer thickness × 100
Loss on Ignition
Weigh dry soil, heat it until organic matter burns away, and use the lost mass to estimate percent organic matter
Physical vs. Chemical vs. Biological Soil Tests
Physical tests measure traits such as texture and permeability; chemical tests measure pH, nutrients, salinity, or CEC; biological tests measure organisms and their activity
Composite Soil Sample
A representative sample made by collecting soil at a consistent depth from several locations and combining it, while sampling visibly different areas separately
Notes
Soil Composition
A mixture of mineral particles, organic matter, water, air, and organisms; idealized productive surface soil is 45% mineral matter, 25% water, 25% air, and 5% organic matter by volume
Soil Organic Matter
The living organisms, roots, recently dead material, and humus in soil that influence water retention, nutrient supply, and structure
Humus
Dark, relatively stable organic material formed by decomposition that helps soil retain water and nutrients and improves structure
Soil Texture
The relative percentages of sand, silt, and clay in the mineral portion of soil
Soil Structure
The way individual soil particles are grouped into aggregates, distinct from the particle percentages measured by texture
Sand
The largest mineral soil particles, 0.05–2.0 mm in diameter; sandy soils are generally highly permeable and retain little water or nutrients
Silt
Intermediate-sized mineral soil particles, 0.002–0.05 mm in diameter, that often feel smooth or flour-like when dry
Clay
The smallest mineral soil particles, less than 0.002 mm in diameter; clay-rich soils generally transmit water slowly and retain substantial water and nutrient cations
Macropores vs. Micropores
Macropores are large pores that transmit water rapidly; micropores are small pores that transmit water slowly and hold it more strongly
Porosity
The percentage of total soil volume occupied by pore space: pore-space volume ÷ total soil volume × 100
Soil Compaction
Compression of soil that destroys pore space, reducing porosity, permeability, infiltration, aeration, and root growth while increasing runoff
Bulk Density
Dry soil mass per total soil volume; a higher bulk density generally indicates greater compaction and less pore space
Permeability
The ability of soil to transmit water through connected pore spaces
Infiltration
The process by which water enters soil at its surface, influenced by texture, vegetation, crusting, slope, and compaction
Soil Permeability Test
Place equal soil depths in identical columns with the same packing, add equal water volumes, and compare drainage time or discharge per unit time; faster drainage indicates greater permeability
Water-Holding Capacity (Water Retention)
The total amount of water a soil can retain in its pores and on particle surfaces
Field Capacity
The amount of water remaining in soil after excess gravitational water has drained away
Permanent Wilting Point
The soil-water level at which plants can no longer extract enough water and remain wilted
Plant-Available Water
The water plants can extract from soil, equal to field capacity minus the permanent wilting point
Water-Holding Capacity Test
Dry equal soil masses, saturate and drain them identically, then calculate retained water as drained wet mass minus dry mass
Soil Fertility
The ability of soil to supply nutrients and other conditions needed for plant growth
Cation Exchange
The reversible transfer of positively charged nutrient ions between negatively charged soil particles and soil water
Cation Exchange Capacity (CEC)
A soil’s ability to hold and exchange nutrient cations; soils rich in clay and humus generally have higher CEC than sandy soils
Soil pH
A logarithmic measure of soil acidity or basicity that affects nutrient availability, microbial activity, and plant growth
Soil pH Test
Mix soil with distilled or deionized water at a consistent ratio, allow it to settle, and test the liquid with a calibrated probe or indicator
Soil Salinity
The concentration of dissolved salts in soil; high salinity interferes with plant water uptake and is often estimated by electrical conductivity
Mineralization
The conversion by soil organisms of nutrients in organic matter into inorganic forms that plants can absorb
Soil Respiration Test
Incubate equal masses of moist soil under controlled conditions and measure CO₂ released; greater release generally indicates greater biological activity
Soil Texture Triangle
A diagram that classifies mineral soil from sand, silt, and clay percentages summing to 100%; plot the three percentage lines and identify their textural region
Loam
A textural class containing a balanced mixture of sand, silt, and clay that commonly provides both water retention and drainage; it is not necessarily equal thirds
Settling-Jar Test
Mix soil with water and let it settle into sand, silt, and clay layers; each percentage is layer thickness ÷ total mineral-layer thickness × 100
Loss on Ignition
Weigh dry soil, heat it until organic matter burns away, and use the lost mass to estimate percent organic matter
Physical vs. Chemical vs. Biological Soil Tests
Physical tests measure traits such as texture and permeability; chemical tests measure pH, nutrients, salinity, or CEC; biological tests measure organisms and their activity
Composite Soil Sample
A representative sample made by collecting soil at a consistent depth from several locations and combining it, while sampling visibly different areas separately
