Topic 3.9 Notes – Demographic Transition
What the Demographic Transition Is
The demographic transition is the shift from high birth rates and high death rates to low birth rates and low death rates as a country moves from a preindustrial economy to an industrialized one. In APES, this is shown with the standard four-stage demographic transition model, or DTM.
A few rate reminders matter here:
- CBR means crude birth rate, or live births per 1,000 people per year.
- CDR means crude death rate, or deaths per 1,000 people per year.
- If CBR > CDR, the population has natural increase.
- If CBR ≈ CDR, growth is near zero.
- If CBR < CDR, the population has natural decrease.
The key thing to notice on any DTM graph is the gap between CBR and CDR. A bigger gap means faster natural population growth. Migration can still change the real population size, but the standard DTM curves only show births and deaths.
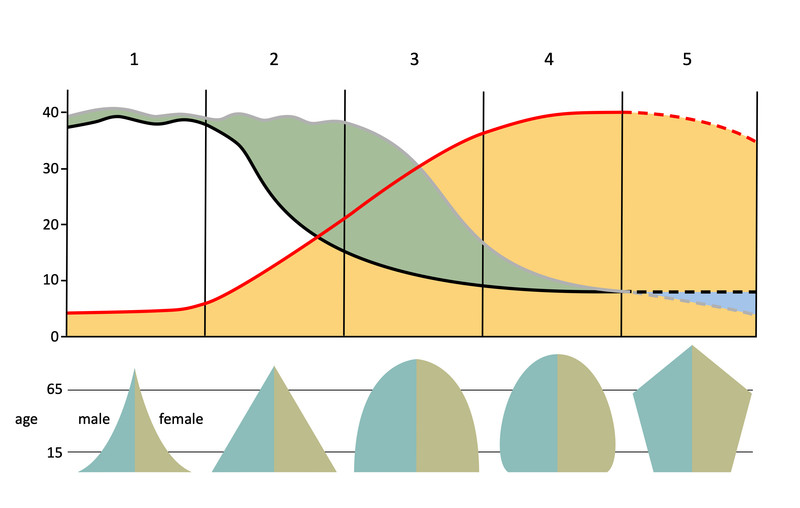
Demographic transition model
On the graph, population growth is the space between the birth-rate and death-rate curves. This version also includes a fifth stage, where the birth rate can dip below the death rate and natural decrease begins.
The Four Stages of the Demographic Transition
The stages go in this order: Stage 1 preindustrial, Stage 2 transitional, Stage 3 industrial, Stage 4 postindustrial.
Stage 1 preindustrial
Both CBR and CDR are high, and the death rate often jumps around. Population growth stays low because births and deaths are both high.
- High death rates come from famine, disease, poor sanitation, unsafe water, limited healthcare, and conflict.
- High birth rates connect to high infant mortality, child labor, limited contraception, and fewer education and job options for women.
- No modern country is fully in Stage 1.
Stage 2 transitional
This is where population usually grows fastest. CBR stays high, but CDR drops sharply.
- Death rates fall because of better food supply, clean water, sanitation, sewage treatment, vaccination, medical care, infectious disease control, and safer housing and workplaces.
- Birth rates stay high longer because family-size norms and access to family planning change more slowly.
Stage 3 industrial
CBR starts to fall, and CDR stays low. Population is still growing, just more slowly because the gap is shrinking.
Birth rates drop with women’s education and employment, contraception, later childbirth, urbanization, lower infant mortality, pensions, and the rising cost of children.
Stage 4 postindustrial
Both CBR and CDR are low and close together. That means little or no natural increase. The population is usually much larger than it was in Stage 1.
This stage is linked to developed countries, widespread family planning, high education, urbanization, later childbearing, and low infant mortality.
Why Population Growth Speeds Up and Then Slows
This is the heart of the whole model. Death rates fall first. Clean water, sanitation, nutrition, vaccines, and basic healthcare can lower mortality pretty quickly. Fertility usually falls later because it depends more on social and cultural change.
The sequence looks like this:
- Stage 1: high births + high deaths = low growth
- Stage 2: deaths fall first = rapid growth
- Stage 3: births fall = growth slows
- Stage 4: both low = little or no growth
A later stage does not mean faster growth. Also, total population can keep rising even when the growth rate falls, as long as births still exceed deaths.
Some graphs show a Stage 5, where CBR stays below CDR, causing natural decrease. That can show up in a prompt, but the required APES model is the standard four-stage version unless the question includes Stage 5.
Developing Countries and Developed Countries in the Model
In this topic, developing countries are usually linked to Stages 2 and 3, and developed countries to Stage 4.
Two traits you need to know for developing countries:
- Higher infant mortality rates can lead families to have more children.
- More children in the workforce can make large families economically useful.
As development increases, compulsory schooling, urbanization, lower infant mortality, and higher costs of raising children all help bring birth rates down.
How to Read a DTM Graph or Country Data
When you classify a country, look mainly at the CBR and CDR pattern, not just whether it is called rich or poor.
- Stage 1: both high and fluctuating
- Stage 2: high CBR, sharply lower CDR
- Stage 3: falling CBR moving toward low CDR
- Stage 4: both low and close together
Useful clues:
- Better sanitation and infant survival, but still-high fertility = Stage 2
- Women’s education, urbanization, later childbirth, declining fertility = Stage 3
- Low fertility, low mortality, aging population = Stage 4
The model is a general pattern, not a perfect rule. War, famine, disease, disasters, policy, culture, migration, and age structure can all change what a country’s data looks like.
Key Takeaways
Demographic Transition
Shift from high birth and death rates to low birth and death rates as a country or region develops from a preindustrial to an industrialized economy
Demographic Transition Model (DTM)
Four-stage model relating development to birth rates, death rates, and population growth; death rates typically fall before birth rates
Crude Birth Rate (CBR)
Number of live births per 1,000 people in a population per year
Crude Death Rate (CDR)
Number of deaths per 1,000 people in a population per year
Stage 1: Preindustrial
High, often variable CBR and CDR produce little natural growth and a relatively small population
Stage 2: Transitional / Early Expanding
CDR falls while CBR remains high, creating a wide gap between the rates and rapid population growth
Stage 3: Industrial / Late Expanding
CBR declines while CDR remains low, so population continues growing but at a slowing rate
Stage 4: Postindustrial
Low CBR and low CDR produce low, near-zero, or sometimes slightly negative natural population growth
Stage 5: Natural Decline
Optional DTM extension in which CBR remains below CDR for a sustained period, producing natural population decline and often accompanying very low fertility and an aging population
Developing Countries vs. Developed Countries
Developing countries generally have higher infant mortality, more children in the workforce, and higher birth rates; developed countries generally have lower levels of each
Notes
Demographic Transition
Shift from high birth and death rates to low birth and death rates as a country or region develops from a preindustrial to an industrialized economy
Demographic Transition Model (DTM)
Four-stage model relating development to birth rates, death rates, and population growth; death rates typically fall before birth rates
Crude Birth Rate (CBR)
Number of live births per 1,000 people in a population per year
Crude Death Rate (CDR)
Number of deaths per 1,000 people in a population per year
Stage 1: Preindustrial
High, often variable CBR and CDR produce little natural growth and a relatively small population
Stage 2: Transitional / Early Expanding
CDR falls while CBR remains high, creating a wide gap between the rates and rapid population growth
Stage 3: Industrial / Late Expanding
CBR declines while CDR remains low, so population continues growing but at a slowing rate
Stage 4: Postindustrial
Low CBR and low CDR produce low, near-zero, or sometimes slightly negative natural population growth
Stage 5: Natural Decline
Optional DTM extension in which CBR remains below CDR for a sustained period, producing natural population decline and often accompanying very low fertility and an aging population
Developing Countries vs. Developed Countries
Developing countries generally have higher infant mortality, more children in the workforce, and higher birth rates; developed countries generally have lower levels of each
