Topic 5.12 Notes – Introduction to Sustainability
What Sustainability Means
Sustainability means meeting present human needs without depleting resources or damaging the natural systems future generations will need.
That long-term part matters. A practice is not sustainable just because it works this year, or even for a few years. The real question is whether it can keep going without shrinking the resource base or ecosystem support system underneath it.
A few ground rules help:
- Sustainability does not mean zero resource use. Humans will use resources. The issue is whether use can be maintained.
- Renewable resources can recover if use stays at or below replacement.
- Nonrenewable resources like coal and oil do not replenish on a human timescale, so using them always reduces the remaining stock.
Stock and flow
This topic makes more sense once you separate stock from flow.
- Stock = how much of a resource exists now
- examples: fish in a population, water in an aquifer, timber in a forest
- Flow = the rate of addition or removal
- examples: fish reproduction, aquifer recharge, logging, water withdrawal
A resource can have a large stock and still be unsustainable if removals stay higher than additions. The diagram below uses a renewable resource to show that idea, with regeneration adding to the stock and harvest removing from it.
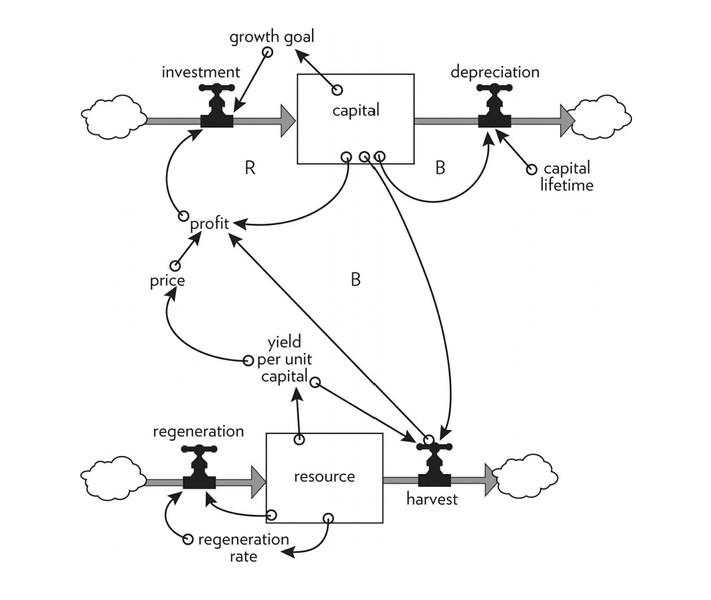
Stock-and-flow model of resource use
In the end, sustainability is judged by whether both resource supplies and ecosystem functions stay intact over time.
Environmental Indicators of Sustainability
Scientists use environmental indicators to tell whether human activity is moving toward or away from sustainability. One number by itself is weak evidence. Trends over time, and multiple indicators together, tell the better story.
Biological diversity
Biodiversity includes diversity at the genetic, species, and ecosystem levels.
- Declining biodiversity usually means ecological stress.
- It also means lower resilience, which is an ecosystem’s ability to recover from disturbance.
- Biodiversity supports ecosystem services such as:
- pollination
- water purification
- nutrient cycling
- pest control
Food production
Food production shows whether people are being supplied with food, but rising production does not automatically mean sustainability.
Production may be high now because of:
- soil erosion
- salinization
- aquifer depletion
- fertilizer overuse
- pollinator loss
- overfishing
That is a classic APES idea. Current output can rise while the system becomes less sustainable.
Average global surface temperature and atmospheric CO₂ concentration
These are paired climate indicators, but they are not identical.
- Atmospheric CO₂ concentration shows buildup of a major greenhouse gas.
- Average global surface temperature shows the climate system’s response.
On graphs, CO₂ usually rises more steadily, and temperature shows more short-term variation around the long-term trend.
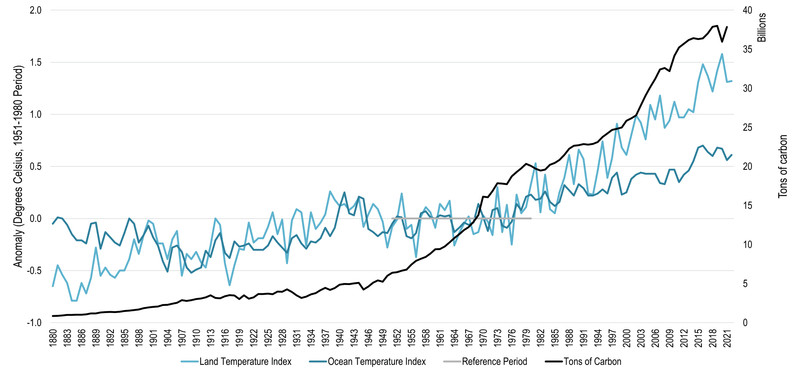
Global temperature and atmospheric CO₂ over time
Long-term upward trends suggest human activities are destabilizing environmental conditions. Temperature can bounce year to year, so the trend matters more than one hot or cool year.
Human population
A larger human population increases total demand for land, food, water, energy, and materials, and also increases waste.
Still, population alone is incomplete. Environmental impact also depends on:
- per-capita consumption
- technology
- efficiency
Resource depletion
Resource depletion is a direct sign that removal exceeds replacement, or that a finite stock is being used up.
Examples of renewable resources that can be depleted:
- fish
- timber
- groundwater
- fertile soil
Nonrenewables also decline with extraction, even if recycling and efficiency slow the loss.
How to Read Sustainability Data
When you see a graph or data table, walk through this logic:
- Identify the indicator.
- Decide whether it is increasing, decreasing, or stable.
- Connect that trend to the environmental system involved.
- Judge whether the pattern supports long-term maintenance of resources and ecosystem function.
A few rules show up a lot on tests:
- Direction matters. Falling biodiversity or falling resource stocks usually signal unsustainability.
- Rate matters. Faster depletion means greater risk.
- Time scale matters. One unusual year is weaker evidence than a long trend.
- Geographic scale matters. Global stability can hide local collapse.
- Total vs. per-capita values matter. Total demand can rise even if per-person demand falls.
- Delayed responses matter. Damage may be underway before the full effect appears.
Sustainable Yield
Sustainable yield is the amount of a renewable resource that can be harvested or withdrawn without reducing the available supply.
It applies to things like fish populations, forests, and recharged freshwater. It does not truly apply to nonrenewables like coal, oil, natural gas, and metal ores.
The basic relationship
- = resource stock
- = regeneration or replenishment
- = harvest or withdrawal
This gives three cases:
- If , stock grows.
- If , stock stays about stable.
- If , stock declines.
What students mix up
- Sustainable yield is not the total stock.
- A large stock can still shrink if harvest stays above regrowth.
- All values must use the same time unit.
Why sustainable yield can change
Regeneration rates can fall because of:
- drought
- habitat loss
- pollution
- invasive species
- climate change
- reduced breeding population
That’s why harvesting right at the apparent limit is risky.
Why It Matters
When use exceeds sustainable yield, you get resource depletion, lower future harvests, ecological disruption, biodiversity loss, and economic hardship.
Two classic examples:
- Overfishing shows that fish can still be available now even when the fishery is unsustainable.
- Groundwater overwithdrawal shows that wells can still produce water while the aquifer is being depleted.
That groundwater pattern is what this aquifer diagram is illustrating, with recharge from precipitation balanced against pumping from a well.
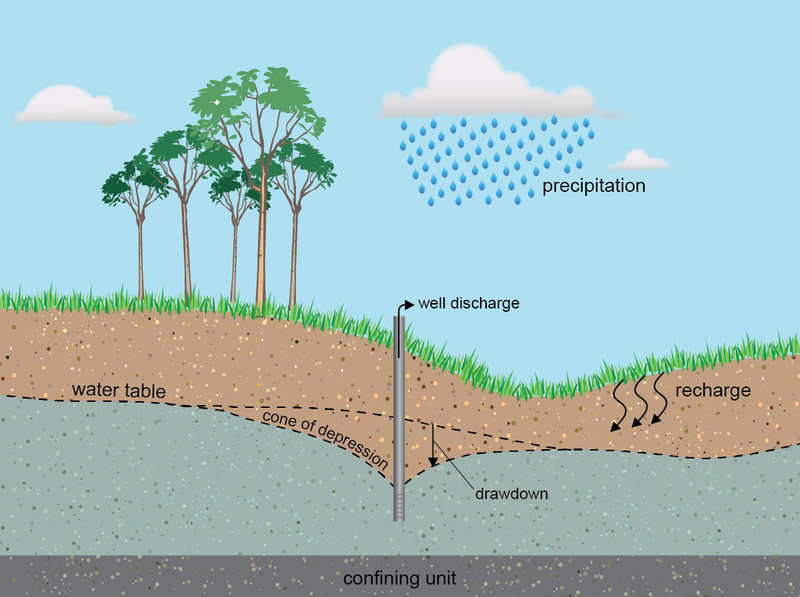
Groundwater withdrawal and recharge
The final test is simple. Are renewable resources being used no faster than they regenerate? And are the ecosystems that make that regeneration possible still being maintained?
Key Takeaways
Sustainability
Using Earth’s resources to meet present needs without depleting resources or undermining natural systems needed by future generations
Environmental Indicator
A measurable condition whose level or trend shows environmental change; key indicators include biodiversity, food production, global temperature and CO₂, human population, and resource depletion
Resource Stock
The amount of a resource currently available
Resource Flow
The rate at which a resource stock is replenished or removed
Resource Depletion
A reduction in a resource’s available stock because removal or consumption exceeds replacement
Sustainable Yield
The amount of a renewable resource that can be removed without reducing its available supply; removal must not exceed regeneration
Notes
Sustainability
Using Earth’s resources to meet present needs without depleting resources or undermining natural systems needed by future generations
Environmental Indicator
A measurable condition whose level or trend shows environmental change; key indicators include biodiversity, food production, global temperature and CO₂, human population, and resource depletion
Resource Stock
The amount of a resource currently available
Resource Flow
The rate at which a resource stock is replenished or removed
Resource Depletion
A reduction in a resource’s available stock because removal or consumption exceeds replacement
Sustainable Yield
The amount of a renewable resource that can be removed without reducing its available supply; removal must not exceed regeneration
