Topic 8.2 Notes – Human Impacts on Ecosystems
How Human Activities Stress Aquatic Ecosystems
Aquatic pollution is not just “poison in water.” Human activity can change physical conditions like turbidity or temperature, chemical conditions like pH or dissolved oxygen, and biological processes like decomposition and algal growth.
What happens depends on more than how much pollutant is present. Effects also depend on:
- Toxicity: how harmful the substance is
- Persistence: how long it stays in the environment
- Location: where it enters and where organisms are exposed
- Interactions: temperature, nutrients, sediment, and water movement can make effects worse
Organisms have a range of tolerance for factors like temperature, salinity, pH, dissolved oxygen, turbidity, and pollutant concentration.
- In the optimum range, they maintain homeostasis and can grow and reproduce.
- Outside that range, they show physiological stress. Growth and reproduction drop before death happens.
- Different species have different tolerance ranges, so pollution often changes the community structure first.
That is why indicator species matter. Sensitive species disappear first, while pollution-tolerant species remain.
A common AP chain is:
- human activity → pollutant or altered condition → mechanism → ecosystem response
Dissolved Oxygen, BOD, and Dead Zones
Dissolved oxygen and biological oxygen demand
Dissolved oxygen (DO) is oxygen available in water for aerobic respiration. Fish and many aquatic organisms need it.
DO increases through:
- Diffusion from the atmosphere
- Photosynthesis by aquatic producers
DO decreases through:
- Respiration
- Decomposition
Warm water holds less oxygen than cool water, which is why heat stress and oxygen stress often go together.
Biological oxygen demand (BOD) is the amount of oxygen aerobic decomposers need to break down organic matter.
High BOD means decomposers are using lots of oxygen, so DO drops.
- Hypoxia = very low oxygen
- Anoxia = no oxygen
Oxygen sag curves
An oxygen sag curve shows dissolved oxygen versus distance downstream from a pollution source. In the graph here, the blue line shows BOD dropping downstream, and the orange line shows DO falling after the discharge point and then recovering.
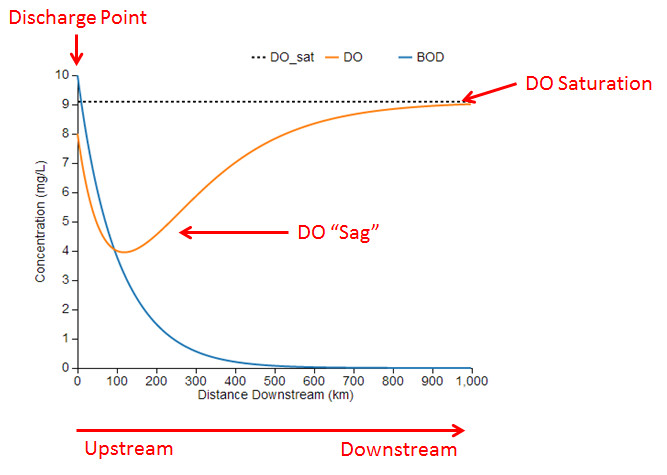
Oxygen sag curve
What you need to notice:
- Upstream clean zone has relatively high DO.
- Organic waste or nutrient input increases decomposition.
- BOD rises and DO falls.
- The lowest DO is downstream, not right at the discharge point.
- Farther downstream, dilution, mixing, reaeration, and photosynthesis help DO recover.
If both are shown, DO sags downward while BOD gradually declines downstream.
Oceanic dead zones
Dead zones are low-oxygen areas, usually caused by nutrient pollution, especially nitrogen and phosphorus.
The main sequence is:
- nutrient input
- algal bloom
- decomposition
- higher BOD
- lower DO
Warm water and stratification make this worse because oxygen-rich surface water does not mix well with deeper water.
Illustrative example:
- Gulf of Mexico dead zone linked to Mississippi River nutrient runoff
Major Human Impacts on Aquatic Ecosystems
Coral reef damage
Coral reefs depend on coral animals and their symbiotic photosynthetic algae.
- Increasing ocean temperature causes bleaching because corals lose the algae
- Sediment runoff increases turbidity, blocks light, and can smother corals
- Destructive fishing can break reef structure or poison reef organisms
A common visual comparison is a bleached reef next to a healthy reef, which helps you connect temperature stress with the loss of color and living algal partners.
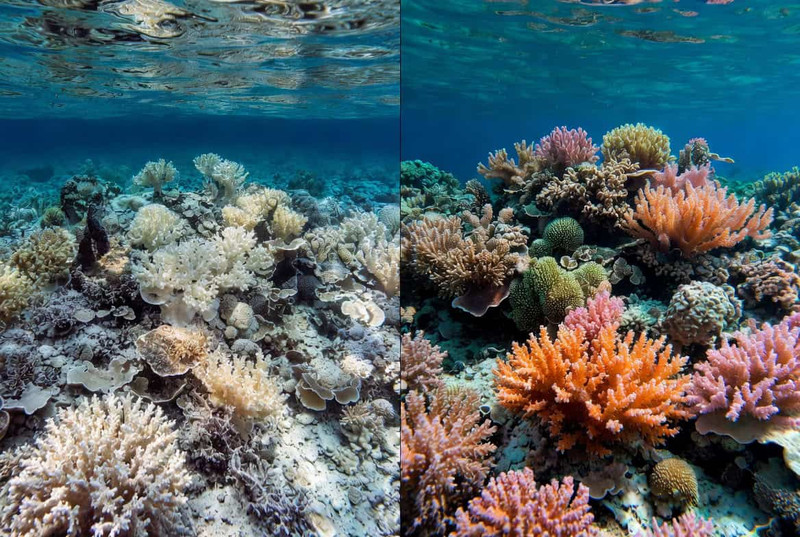
Coral bleaching compared with a healthy reef
Oil spills
Oil spills harm water, coastlines, wildlife, and local economies.
- Hydrocarbons in oil are toxic
- Surface oil coats bird feathers and marine mammal fur, reducing insulation and waterproofing
- Some oil sinks and harms bottom-dwelling organisms
- Oil on beaches damages habitat and is hard to clean up
- Fishing and tourism often lose money after spills
Illustrative examples:
- Exxon Valdez
- Deepwater Horizon
Heavy metals and mercury
Heavy metals such as lead, mercury, and cadmium can come from mining, industry, waste, and fossil-fuel combustion.
- They can contaminate groundwater and drinking water
- They persist because they do not biodegrade
Mercury has a key extra step:
- mercury release → aquatic entry → bacterial conversion → methylmercury → food chain
Litter and sediment
Litter can cause:
- intestinal blockage
- choking
- entanglement
- toxic exposure
Sediment causes two major problems:
- Suspended sediment increases turbidity and reduces light, hurting primary producers and visual predators
- Deposited sediment buries eggs, benthic organisms, plants, and corals
Sediment can also carry phosphorus, pesticides, and metals.
How to Explain Impacts and Match Solutions
On FRQs, clear cause-and-effect earns points. A strong explanation usually follows this order:
- Identify the human activity
- Name the pollutant or altered condition
- Explain the mechanism
- State the organism or ecosystem effect
- Match the solution to that cause
Examples of matching solutions:
- Reduce nutrient runoff for dead zones
- Control erosion for sediment pollution
- Improve wastewater treatment for high BOD and nutrient input
- Prevent oil releases for spill damage
- Manage mine drainage and industrial discharge for heavy metals
- Improve waste collection for litter
The best final sentence explains why the solution works by saying which link in the chain it breaks.
Key Takeaways
Range of Tolerance
The span of environmental conditions an organism can survive; performance is highest in the optimum range, declines in zones of physiological stress, and reaches death beyond the limits of tolerance
Indicator Species
A species whose presence, absence, or abundance provides evidence about environmental conditions, often because it is sensitive to pollution
Dissolved Oxygen (DO)
Oxygen gas dissolved in water and available for aerobic respiration, commonly measured in mg/L.
Biological Oxygen Demand (Biochemical Oxygen Demand, BOD)
The amount of dissolved oxygen aerobic microorganisms require to decompose organic matter; high BOD generally causes DO to fall
Five-Day Biological Oxygen Demand (BOD₅)
Measure initial DO, seal the sample in darkness for five days at 20°C, measure final DO, and calculate BOD₅ = initial DO − final DO for an undiluted sample
Oxygen Sag Curve
A graph of DO versus distance downstream from an organic-waste or nutrient source: DO falls as decomposition raises BOD, reaches a minimum downstream, and may recover through reaeration, mixing, and photosynthesis
Oceanic Dead Zone
An area of very low dissolved oxygen caused when nutrient-driven biomass dies and decomposition raises BOD, suffocating or displacing aquatic organisms
Coral Bleaching
The loss or expulsion of a coral's symbiotic algae under stress, especially elevated temperature, exposing the white skeleton and depriving the coral of a major energy source
Oil Spill
A petroleum release that can poison organisms with hydrocarbons, coat birds and mammals, contaminate benthic habitats and shorelines, and harm fisheries and tourism
Heavy-Metal Contamination
Persistent pollution by metallic elements such as lead, mercury, and cadmium, often released by mining, industry, waste, or fossil-fuel combustion and capable of contaminating groundwater and drinking water
Pollutant Concentration vs. Pollutant Load
Concentration is pollutant amount per unit volume, while load is the total amount transported over time; load = concentration × water flow
Methylmercury
A highly toxic, readily absorbed organic form of mercury produced when aquatic bacteria convert elemental or inorganic mercury, allowing it to enter food chains
Litter in Aquatic Ecosystems
Discarded material in water that can cause ingestion, choking, intestinal blockage, entanglement, habitat damage, and the movement of toxic substances into food chains
Turbidity
Water cloudiness caused by suspended particles that reduces light penetration and can impair photosynthesis and visual feeding
Sediment Pollution
Excess particles delivered to water by erosion; suspended sediment raises turbidity and reduces light, while deposited sediment buries, fills, or smothers bottom habitats
Hypoxia
A condition in which dissolved oxygen is too low to support many aquatic animals; 2 mg/L DO is a common benchmark
Anoxia
The complete absence of dissolved oxygen in water
Notes
Range of Tolerance
The span of environmental conditions an organism can survive; performance is highest in the optimum range, declines in zones of physiological stress, and reaches death beyond the limits of tolerance
Indicator Species
A species whose presence, absence, or abundance provides evidence about environmental conditions, often because it is sensitive to pollution
Dissolved Oxygen (DO)
Oxygen gas dissolved in water and available for aerobic respiration, commonly measured in mg/L.
Biological Oxygen Demand (Biochemical Oxygen Demand, BOD)
The amount of dissolved oxygen aerobic microorganisms require to decompose organic matter; high BOD generally causes DO to fall
Five-Day Biological Oxygen Demand (BOD₅)
Measure initial DO, seal the sample in darkness for five days at 20°C, measure final DO, and calculate BOD₅ = initial DO − final DO for an undiluted sample
Oxygen Sag Curve
A graph of DO versus distance downstream from an organic-waste or nutrient source: DO falls as decomposition raises BOD, reaches a minimum downstream, and may recover through reaeration, mixing, and photosynthesis
Oceanic Dead Zone
An area of very low dissolved oxygen caused when nutrient-driven biomass dies and decomposition raises BOD, suffocating or displacing aquatic organisms
Coral Bleaching
The loss or expulsion of a coral's symbiotic algae under stress, especially elevated temperature, exposing the white skeleton and depriving the coral of a major energy source
Oil Spill
A petroleum release that can poison organisms with hydrocarbons, coat birds and mammals, contaminate benthic habitats and shorelines, and harm fisheries and tourism
Heavy-Metal Contamination
Persistent pollution by metallic elements such as lead, mercury, and cadmium, often released by mining, industry, waste, or fossil-fuel combustion and capable of contaminating groundwater and drinking water
Pollutant Concentration vs. Pollutant Load
Concentration is pollutant amount per unit volume, while load is the total amount transported over time; load = concentration × water flow
Methylmercury
A highly toxic, readily absorbed organic form of mercury produced when aquatic bacteria convert elemental or inorganic mercury, allowing it to enter food chains
Litter in Aquatic Ecosystems
Discarded material in water that can cause ingestion, choking, intestinal blockage, entanglement, habitat damage, and the movement of toxic substances into food chains
Turbidity
Water cloudiness caused by suspended particles that reduces light penetration and can impair photosynthesis and visual feeding
Sediment Pollution
Excess particles delivered to water by erosion; suspended sediment raises turbidity and reduces light, while deposited sediment buries, fills, or smothers bottom habitats
Hypoxia
A condition in which dissolved oxygen is too low to support many aquatic animals; 2 mg/L DO is a common benchmark
Anoxia
The complete absence of dissolved oxygen in water
